
Kyocera Corp. ADR (KYOCY): Price and Financial Metrics
KYOCY Price/Volume Stats
| Current price | $12.11 | 52-week high | $15.63 |
| Prev. close | $11.99 | 52-week low | $10.98 |
| Day low | $12.05 | Volume | 31,700 |
| Day high | $12.12 | Avg. volume | 154,866 |
| 50-day MA | $11.80 | Dividend yield | 2.01% |
| 200-day MA | $13.13 | Market Cap | 17.39B |
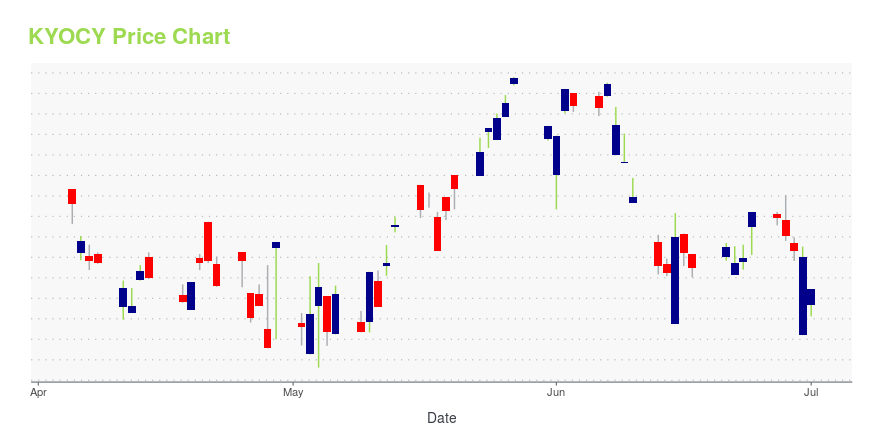
KYOCY Stock Price Chart Interactive Chart >
Kyocera Corp. ADR (KYOCY) Company Bio
Kyocera Corporation (京セラ株式会社, Kyōsera Kabushiki-gaisha, pronounced [kʲoːseɾa]) is a Japanese multinational ceramics and electronics manufacturer headquartered in Kyoto, Japan. It was founded as Kyoto Ceramic Company, Limited (京都セラミック株式会社, Kyōto Seramikku Kabushiki-gaisha) in 1959 by Kazuo Inamori and renamed in 1982. It manufactures industrial ceramics, solar power generating systems, telecommunications equipment, office document imaging equipment, electronic components, semiconductor packages, cutting tools, and components for medical and dental implant systems. (Source:Wikipedia)
Latest KYOCY News From Around the Web
Below are the latest news stories about Kyocera Corp that investors may wish to consider to help them evaluate KYOCY as an investment opportunity.
KYOCERA Announces Consolidated Financial Results for Third Quarter, Ended Dec. 31, 2021KYOTO, Japan, January 31, 2022--Kyocera Corporation announced its consolidated financial results for the third quarter of the fiscal year ending March 31, 2022. |
Development of an Innovative Customer Preference Management System for Retail Apparel ShopsKYOTO, Japan, January 26, 2022--Kyocera Corporation (President: Hideo Tanimoto) and TSI HOLDINGS CO., LTD. (President: Tsuyoshi Shimoji) are developing a new Customer Preference Management System to provide customer preferences in stores as a means of enhancing service and customer satisfaction. |
Kyocera DuraSport 5G UW review: tough choicesKyocera’s latest rugged phone for Verizon is the mid-range DuraSport 5G UW. It’s a tough phone with good warranty and software support, but you pay a hefty premium for its tough exterior. |
KYOCERA SLD Laser Achieves World Record LiFi Communications Data Rate 100 times faster than 5GGOLETA, Calif., January 05, 2022--KYOCERA SLD Laser, Inc. (KSLD), a world leader in commercialization of laser light sources, has announced the achievement of the world’s fastest LiFi system that delivers greater than 90 gigabit per second (90 Gbps), 100 times faster data rate than 5G. The company will demonstrate its award winning DataLight™ innovation for automotive and consumer applications at the Consumer Electronics Show January 5 – 7, 2022. |
Ceramic Tubes Market is Projected to Grow at a CAGR of 7.50% Over the Forecast Period from 2021 to 2030; Quince Market InsightsMajor companies operating in the global ceramic tubes market, which include KYOCERA Corporation (Japan), Xiamen Innovacera Advanced Materials Co., Ltd. (China), Morgan Advanced Materials (U.K.), Rauschert GmbH (Germany), Mantec Technical Ceramics (U.K.), HP Technical Ceramics (U.K.) Major companies operating in the global ceramic tubes market, which include KYOCERA Corporation (Japan), Xiamen Innovacera Advanced Materials Co., Ltd. (China), Morgan Advanced Materials (U.K.), Rauschert GmbH (Germany), Mantec Technical Ceramics (U.K.), HP Technical Ceramics (U.K.) |
KYOCY Price Returns
| 1-mo | 4.31% |
| 3-mo | 2.28% |
| 6-mo | -16.96% |
| 1-year | -8.89% |
| 3-year | -20.24% |
| 5-year | -22.48% |
| YTD | -17.25% |
| 2023 | 19.56% |
| 2022 | -21.11% |
| 2021 | 2.90% |
| 2020 | -8.92% |
| 2019 | 38.54% |
KYOCY Dividends
| Ex-Dividend Date | Type | Payout Amount | Change | ||||||
|---|---|---|---|---|---|---|---|---|---|
| Loading, please wait... | |||||||||
Continue Researching KYOCY
Want to do more research on Kyocera Corp's stock and its price? Try the links below:Kyocera Corp (KYOCY) Stock Price | Nasdaq
Kyocera Corp (KYOCY) Stock Quote, History and News - Yahoo Finance
Kyocera Corp (KYOCY) Stock Price and Basic Information | MarketWatch
Loading social stream, please wait...