Lancaster Colony Corporation (LANC): Price and Financial Metrics
GET POWR RATINGS... FREE!
LANC POWR Grades
- Stability is the dimension where LANC ranks best; there it ranks ahead of 96.2% of US stocks.
- The strongest trend for LANC is in Momentum, which has been heading up over the past 179 days.
- LANC's current lowest rank is in the Sentiment metric (where it is better than 11.73% of US stocks).
LANC Stock Summary
- Lancaster Colony Corp's stock had its IPO on March 26, 1990, making it an older stock than 84.38% of US equities in our set.
- Price to trailing twelve month operating cash flow for LANC is currently 33.55, higher than 83.45% of US stocks with positive operating cash flow.
- The ratio of debt to operating expenses for Lancaster Colony Corp is higher than it is for about merely 12.52% of US stocks.
- Stocks with similar financial metrics, market capitalization, and price volatility to Lancaster Colony Corp are FHI, INUV, TAYD, MMI, and AIR.
- LANC's SEC filings can be seen here. And to visit Lancaster Colony Corp's official web site, go to www.lancastercolony.com.
LANC Valuation Summary
- In comparison to the median Consumer Defensive stock, LANC's price/sales ratio is 22.22% higher, now standing at 3.3.
- LANC's price/sales ratio has moved up 2.2 over the prior 243 months.
- LANC's EV/EBIT ratio has moved up 17.2 over the prior 243 months.
Below are key valuation metrics over time for LANC.
Stock | Date | P/S | P/B | P/E | EV/EBIT |
---|---|---|---|---|---|
LANC | 2021-09-03 | 3.3 | 5.7 | 33.9 | 25.1 |
LANC | 2021-09-02 | 3.3 | 5.8 | 34.2 | 25.3 |
LANC | 2021-09-01 | 3.3 | 5.7 | 33.9 | 25.0 |
LANC | 2021-08-31 | 3.3 | 5.8 | 34.3 | 25.4 |
LANC | 2021-08-30 | 3.3 | 5.8 | 34.3 | 25.4 |
LANC | 2021-08-27 | 3.4 | 5.9 | 34.8 | 25.7 |
LANC Growth Metrics
- Its year over year net cashflow from operations growth rate is now at 9.82%.
- The 5 year net cashflow from operations growth rate now stands at 26.71%.
- The 4 year net income to common stockholders growth rate now stands at 19.61%.

The table below shows LANC's growth in key financial areas (numbers in millions of US dollars).
Date | Revenue | Operating Cash Flow | Net Income to Common Stock |
---|---|---|---|
2021-12-31 | 1,563.298 | 125.313 | 125.648 |
2021-09-30 | 1,509.886 | 149.374 | 135.908 |
2021-06-30 | 1,467.067 | 174.189 | 142.332 |
2021-03-31 | 1,402.355 | 190.33 | 140.991 |
2020-12-31 | 1,366.469 | 156.246 | 134.523 |
2020-09-30 | 1,346.571 | 154.317 | 133.317 |
LANC's Quality Factors
The “Quality” component of the POWR Ratings focuses on 31 different factors of a companies fundamentals and operational strength. Here are some key insights as we drill into the specifics of these quality attributes.- LANC has a Quality Grade of C, ranking ahead of 68.06% of graded US stocks.
- LANC's asset turnover comes in at 1.392 -- ranking 14th of 59 Food Products stocks.
- FLO, BRID, and LNDC are the stocks whose asset turnover ratios are most correlated with LANC.
The table below shows LANC's key quality metrics over time.
Period | Asset Turnover | Gross Margin | ROIC |
---|---|---|---|
2021-09-30 | 1.392 | 0.256 | 0.364 |
2021-06-30 | 1.381 | 0.264 | 0.404 |
2021-03-31 | 1.355 | 0.270 | 0.420 |
2020-12-31 | 1.345 | 0.268 | 0.413 |
2020-09-30 | 1.348 | 0.266 | 0.418 |
2020-06-30 | 1.357 | 0.268 | 0.442 |
LANC Price Target
For more insight on analysts targets of LANC, see our LANC price target page. And for a list of of all stocks sorted by upside potential based on analyst target price, see our Top Price Target page.
Average Price Target | $202.67 | Average Broker Recommendation | 1.75 (Moderate Buy) |
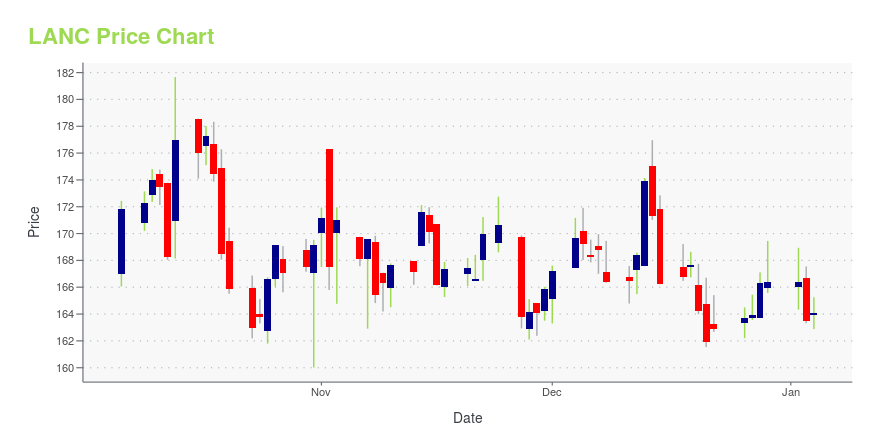
LANC Stock Price Chart Interactive Chart >
LANC Price/Volume Stats
Current price | $124.49 | 52-week high | $201.31 |
Prev. close | $125.39 | 52-week low | $118.99 |
Day low | $123.91 | Volume | 301,400 |
Day high | $127.70 | Avg. volume | 114,276 |
50-day MA | $147.11 | Dividend yield | 2.57% |
200-day MA | $161.38 | Market Cap | 3.43B |
Lancaster Colony Corporation (LANC) Company Bio
Lancaster Colony manufactures and markets specialty food products for the retail and foodservice markets in the United States. The company was founded in 1961 and is based in Columbus, Ohio.
Latest LANC News From Around the Web
Below are the latest news stories about Lancaster Colony Corp that investors may wish to consider to help them evaluate LANC as an investment opportunity.
Lancaster Colony declares $0.80 dividendLancaster Colony (NASDAQ:LANC) declares $0.80/share quarterly dividend, in line with previous. Forward yield 1.97% Payable March 31; for shareholders of record March 9; ex-div March 8. See LANC Dividend Scorecard, Yield Chart, & Dividend Growth.... |
LANCASTER COLONY CONTINUES HIGHER CASH DIVIDENDLancaster Colony Corporation (Nasdaq: LANC) announced today that its Board of Directors has declared a quarterly cash dividend of 80 cents per common share, payable March 31, 2022 to shareholders of record on March 9, 2022. |
Is Lancaster Colony Corporation's (NASDAQ:LANC) Shareholder Ownership Skewed Towards Insiders?If you want to know who really controls Lancaster Colony Corporation ( NASDAQ:LANC ), then you'll have to look at the... |
Diamond Hill Capital Management Buys Becton, Dickinson and Co, SS&C Technologies Holdings ...Investment company Diamond Hill Capital Management (Current Portfolio) buys Becton, Dickinson and Co, SS&C Technologies Holdings Inc, Texas Instruments Inc, Coterra Energy Inc, Nasdaq Inc, sells Charles Schwab Corp, Gilead Sciences Inc, First Republic Bank, MetLife Inc, Cadence Bank during the 3-months ended 2021Q4, according to the most recent filings of the investment company, Diamond Hill Capital Management. |
Lancaster Colony GAAP EPS of $1.25, revenue of $428.4MLancaster Colony press release (NASDAQ:LANC): Q2 GAAP EPS of $1.25. Revenue of $428.4M (+14.2% Y/Y). "We anticipate the unfavorable impacts of higher input costs, increased freight and warehousing costs, elevated expenditures attributed to the enduring supply chain challenges, and higher labor costs will remain a headwind to our financial results... |
LANC Price Returns
1-mo | -19.10% |
3-mo | -25.58% |
6-mo | -20.19% |
1-year | -32.41% |
3-year | -10.10% |
5-year | 8.27% |
YTD | -24.46% |
2021 | -8.26% |
2020 | 16.75% |
2019 | -7.88% |
2018 | 39.22% |
2017 | -6.99% |
LANC Dividends
Ex-Dividend Date | Type | Payout Amount | Change | ||||||
---|---|---|---|---|---|---|---|---|---|
Loading, please wait... |
Continue Researching LANC
Want to see what other sources are saying about Lancaster Colony Corp's financials and stock price? Try the links below:Lancaster Colony Corp (LANC) Stock Price | Nasdaq
Lancaster Colony Corp (LANC) Stock Quote, History and News - Yahoo Finance
Lancaster Colony Corp (LANC) Stock Price and Basic Information | MarketWatch
Loading social stream, please wait...