
Lakeland Bancorp, Inc. (LBAI): Price and Financial Metrics
LBAI Price/Volume Stats
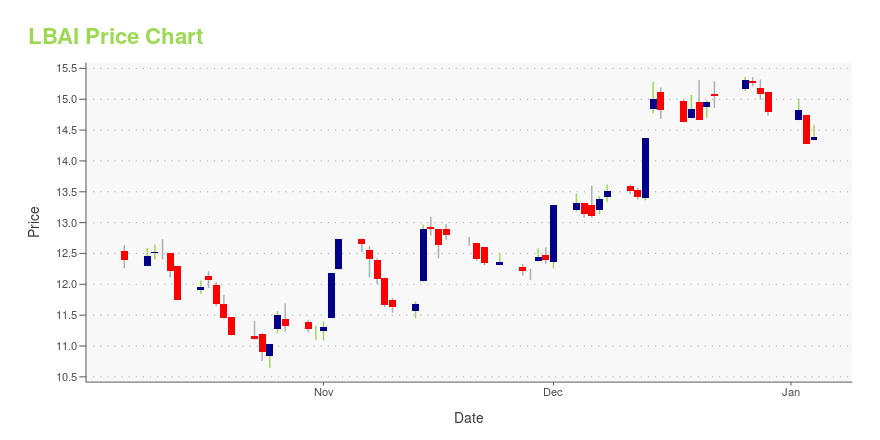
| Current price | $13.43 | 52-week high | $16.00 |
| Prev. close | $13.28 | 52-week low | $10.65 |
| Day low | $13.09 | Volume | 1,361,400 |
| Day high | $13.52 | Avg. volume | 312,240 |
| 50-day MA | $12.23 | Dividend yield | 4.37% |
| 200-day MA | $12.88 | Market Cap | 875.03M |
LBAI Stock Price Chart Interactive Chart >
Lakeland Bancorp, Inc. (LBAI) Company Bio
Lakeland Bancorp provides banking services for individuals, professionals, and small to medium sized businesses in northern and central New Jersey. The company was founded in 1969 and is based in Oak Ridge, New Jersey.
Latest LBAI News From Around the Web
Below are the latest news stories about LAKELAND BANCORP INC that investors may wish to consider to help them evaluate LBAI as an investment opportunity.
Provident (PFS) & Lakeland (LBAI) Extend Merger AgreementProvident (PFS) and Lakeland (LBAI) announce the extension of their merger agreement to the end of first-quarter 2024, which was initially expected to close in second-quarter 2023. |
Provident, Lakeland extend merger agreementThe deal, originally projected to close earlier this year, has been extended through March. |
New Jersey banks extend deadline to close their $1.3 billion mergerProvident Financial in Iselin initially anticipated completing its deal for Oak Ridge-based Lakeland Bancorp in the second quarter. Now as it waits for regulatory approval, Provident says the process will stretch into spring 2024. |
Provident Financial Services, Inc. and Lakeland Bancorp, Inc. Extend Merger AgreementISELIN, N.J. and OAK RIDGE, N.J., Dec. 20, 2023 (GLOBE NEWSWIRE) -- Provident Financial Services, Inc. (NYSE:PFS) (“Provident”), the parent company of Provident Bank, and Lakeland Bancorp, Inc. (Nasdaq: LBAI) (“Lakeland”), the parent company of Lakeland Bank, today announced that the two companies have agreed to extend their merger agreement to March 31, 2024, to provide additional time to obtain the required regulatory approvals. Both parties remain committed to the merger and to obtaining regu |
With 60% ownership of the shares, Lakeland Bancorp, Inc. (NASDAQ:LBAI) is heavily dominated by institutional ownersKey Insights Given the large stake in the stock by institutions, Lakeland Bancorp's stock price might be vulnerable to... |
LBAI Price Returns
| 1-mo | N/A |
| 3-mo | 7.27% |
| 6-mo | -5.05% |
| 1-year | -9.88% |
| 3-year | -6.36% |
| 5-year | -2.23% |
| YTD | -7.11% |
| 2023 | -12.51% |
| 2022 | -4.05% |
| 2021 | 54.28% |
| 2020 | -23.71% |
| 2019 | 20.95% |
LBAI Dividends
| Ex-Dividend Date | Type | Payout Amount | Change | ||||||
|---|---|---|---|---|---|---|---|---|---|
| Loading, please wait... | |||||||||
Continue Researching LBAI
Want to do more research on Lakeland Bancorp Inc's stock and its price? Try the links below:Lakeland Bancorp Inc (LBAI) Stock Price | Nasdaq
Lakeland Bancorp Inc (LBAI) Stock Quote, History and News - Yahoo Finance
Lakeland Bancorp Inc (LBAI) Stock Price and Basic Information | MarketWatch
Loading social stream, please wait...