LCI Industries (LCII): Price and Financial Metrics

LCI Industries (LCII): $118.53

1.34 (-1.12%)

POWR Rating

Component Grades

Momentum

C

Stability

C

Sentiment

Quality

B

LCII Price/Volume Stats

Current price $118.53 52-week high $137.07
Prev. close $119.87 52-week low $89.28
Day low $117.16 Volume 115,456
Day high $119.48 Avg. volume 187,093
50-day MA $126.31 Dividend yield 3.51%
200-day MA $114.36 Market Cap 3.00B

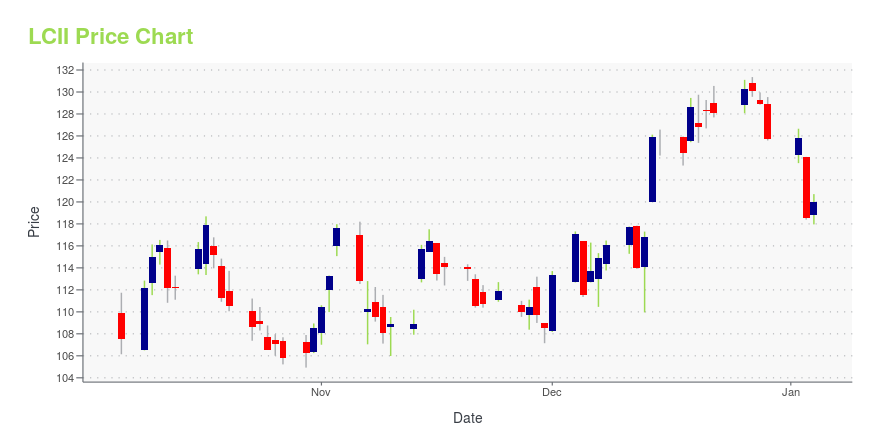
LCII Stock Price Chart Interactive Chart >

LCII POWR Grades

  • LCII scores best on the Quality dimension, with a Quality rank ahead of 76.96% of US stocks.
  • The strongest trend for LCII is in Value, which has been heading down over the past 179 days.
  • LCII's current lowest rank is in the Sentiment metric (where it is better than 5.77% of US stocks).

LCII Stock Summary

  • LCI INDUSTRIES's stock had its IPO on May 3, 1989, making it an older stock than 89.34% of US equities in our set.
  • Of note is the ratio of LCI INDUSTRIES's sales and general administrative expense to its total operating expenses; 87.22% of US stocks have a lower such ratio.
  • Revenue growth over the past 12 months for LCI INDUSTRIES comes in at -27.79%, a number that bests merely 9.35% of the US stocks we're tracking.
  • Stocks with similar financial metrics, market capitalization, and price volatility to LCI INDUSTRIES are HBB, ACU, DBI, PGTI, and VPG.
  • LCII's SEC filings can be seen here. And to visit LCI INDUSTRIES's official web site, go to www.lci1.com.

LCII Valuation Summary

  • LCII's price/sales ratio is 0.7; this is 63.16% lower than that of the median Consumer Cyclical stock.
  • Over the past 243 months, LCII's price/sales ratio has gone up 0.1.

Below are key valuation metrics over time for LCII.

Stock Date P/S P/B P/E EV/EBIT
LCII 2023-09-13 0.7 2.2 35.2 29.8
LCII 2023-09-12 0.7 2.2 35.2 29.8
LCII 2023-09-11 0.7 2.1 34.6 29.4
LCII 2023-09-08 0.7 2.2 35.0 29.7
LCII 2023-09-07 0.7 2.2 35.0 29.7
LCII 2023-09-06 0.8 2.2 35.5 30.0

LCII Growth Metrics

    The 5 year cash and equivalents growth rate now stands at 52.22%.
  • Its year over year cash and equivalents growth rate is now at -12.43%.
  • The year over year revenue growth rate now stands at 63.13%.
Over the past 33 months, LCII's revenue has gone up $3,154,725,000.

The table below shows LCII's growth in key financial areas (numbers in millions of US dollars).

Date Revenue Operating Cash Flow Net Income to Common Stock
2022-09-30 5,526.207 361.641 494.432
2022-06-30 5,559.437 212.539 496.441
2022-03-31 5,117.007 18.506 409.8
2021-12-31 4,472.697 -111.573 287.739
2021-09-30 4,042.289 31.206 254.103
2021-06-30 3,704.709 153.158 259.049

LCII's Quality Factors

The “Quality” component of the POWR Ratings focuses on 31 different factors of a companies fundamentals and operational strength. Here are some key insights as we drill into the specifics of these quality attributes.
  • LCII has a Quality Grade of C, ranking ahead of 62.42% of graded US stocks.
  • LCII's asset turnover comes in at 1.516 -- ranking 14th of 68 Automobiles and Trucks stocks.
  • DORM, LEA, and THO are the stocks whose asset turnover ratios are most correlated with LCII.

The table below shows LCII's key quality metrics over time.

Period Asset Turnover Gross Margin ROIC
2021-09-30 1.516 0.235 0.161
2021-06-30 1.530 0.248 0.183
2021-03-31 1.405 0.252 0.160
2020-12-31 1.319 0.253 0.131
2020-09-30 1.282 0.245 0.119
2020-06-30 1.272 0.233 0.100

LCI Industries (LCII) Company Bio


LCI Industries, formerly known as Drew Industries, supplies a broad array of components for the leading manufacturers of recreational vehicles and manufactured homes, and to a lesser extent supplies components for adjacent industries including buses; trailers used to haul boats, livestock, equipment and other cargo; modular housing; and factory-built mobile office units. The company was founded in 1962 and is based in Elkhart, Indiana.


LCII Latest News Stream


Event/Time News Detail
Loading, please wait...

LCII Latest Social Stream


Loading social stream, please wait...

View Full LCII Social Stream

Latest LCII News From Around the Web

Below are the latest news stories about LCI INDUSTRIES that investors may wish to consider to help them evaluate LCII as an investment opportunity.

Don't Race Out To Buy LCI Industries (NYSE:LCII) Just Because It's Going Ex-Dividend

It looks like LCI Industries ( NYSE:LCII ) is about to go ex-dividend in the next four days. The ex-dividend date is...

Yahoo | August 26, 2023

LCI Industries (NYSE:LCII) Has Announced A Dividend Of $1.05

The board of LCI Industries ( NYSE:LCII ) has announced that it will pay a dividend of $1.05 per share on the 15th of...

Yahoo | August 25, 2023

LCI Industries Declares Quarterly Cash Dividend

ELKHART, Ind., August 21, 2023--LCI Industries (NYSE: LCII), which, through its wholly-owned subsidiary, Lippert Components, Inc. ("Lippert"), supplies a broad array of highly engineered components for the leading original equipment manufacturers ("OEMs") in the recreation and transportation product markets, and the related aftermarkets of those industries, today announced that its Board of Directors approved a regular quarterly cash dividend of $1.05 per share of common stock.

Yahoo | August 21, 2023

LCI Industries Reports Second Quarter Financial Results

ELKHART, Ind., August 08, 2023--LCI Industries (NYSE: LCII) which, through its wholly-owned subsidiary, Lippert Components, Inc. ("Lippert"), supplies a broad array of highly engineered components for the leading original equipment manufacturers ("OEMs") in the recreation, transportation products, and housing markets, and the related aftermarkets of those industries, today reported second quarter 2023 results.

Yahoo | August 8, 2023

LCI Industries' (NYSE:LCII) investors will be pleased with their respectable 65% return over the last five years

If you buy and hold a stock for many years, you'd hope to be making a profit. Furthermore, you'd generally like to see...

Yahoo | July 24, 2023

Read More 'LCII' Stories Here

LCII Price Returns

1-mo -3.91%
3-mo 2.19%
6-mo 15.51%
1-year 11.02%
3-year 24.94%
5-year 49.78%
YTD 31.77%
2022 -38.49%
2021 23.07%
2020 24.13%
2019 65.13%
2018 -47.23%

LCII Dividends

Ex-Dividend Date Type Payout Amount Change
Loading, please wait...
View Full LCII Dividend History

Get Free Updates

Join thousands of investors who get the latest news, insights and top rated picks from StockNews.com!