Lennar Corp. CI A (LEN): Price and Financial Metrics

Lennar Corp. CI A (LEN): $112.00

3.86 (+3.57%)

POWR Rating

Component Grades

Momentum

A

Stability

C

Sentiment

Quality

B

Add LEN to Watchlist
Sign Up

Industry: Homebuilders

Industry

B

Ranked

#7 of 25

in industry

LEN Price/Volume Stats

Current price $112.00 52-week high $116.18
Prev. close $108.14 52-week low $62.54
Day low $108.79 Volume 3,407,700
Day high $112.73 Avg. volume 2,115,448
50-day MA $108.93 Dividend yield 1.4%
200-day MA $93.45 Market Cap 32.41B

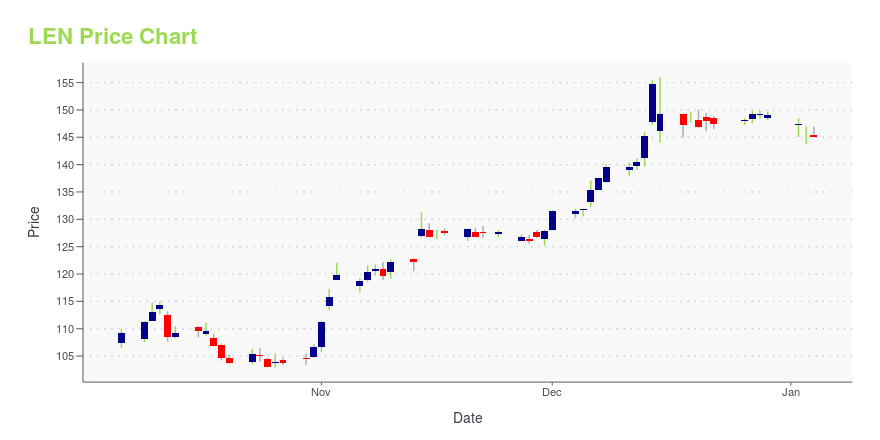
LEN Stock Price Chart Interactive Chart >

LEN POWR Grades

  • LEN scores best on the Momentum dimension, with a Momentum rank ahead of 99.98% of US stocks.
  • The strongest trend for LEN is in Growth, which has been heading down over the past 179 days.
  • LEN's current lowest rank is in the Growth metric (where it is better than 10.37% of US stocks).

LEN Stock Summary

  • LEN has a market capitalization of $31,226,338,012 -- more than approximately 92.83% of US stocks.
  • LENNAR CORP's stock had its IPO on November 5, 1987, making it an older stock than 91.7% of US equities in our set.
  • The ratio of debt to operating expenses for LENNAR CORP is higher than it is for about 89.17% of US stocks.
  • Stocks with similar financial metrics, market capitalization, and price volatility to LENNAR CORP are TWKS, CHCI, FN, CLEU, and CDMO.
  • Visit LEN's SEC page to see the company's official filings. To visit the company's web site, go to www.lennar.com.

LEN Valuation Summary

  • LEN's price/sales ratio is 1; this is 44.44% lower than that of the median Consumer Cyclical stock.
  • LEN's price/earnings ratio has moved down 0.1 over the prior 243 months.

Below are key valuation metrics over time for LEN.

Stock Date P/S P/B P/E EV/EBIT
LEN 2023-05-19 1 1.3 7.0 5.4
LEN 2023-05-18 1 1.4 7.1 5.5
LEN 2023-05-17 1 1.4 7.0 5.4
LEN 2023-05-16 1 1.4 7.0 5.4
LEN 2023-05-15 1 1.3 7.0 5.4
LEN 2023-05-12 1 1.3 7.0 5.4

LEN Growth Metrics

    Its year over year revenue growth rate is now at 20.16%.
  • The 3 year net income to common stockholders growth rate now stands at 118.52%.
  • The 5 year revenue growth rate now stands at 102.74%.
Over the past 70 months, LEN's revenue has gone up $22,377,247,000.

The table below shows LEN's growth in key financial areas (numbers in millions of US dollars).

Date Revenue Operating Cash Flow Net Income to Common Stock
2022-12-31 33,671.01 3,265.668 4,614.125
2022-09-30 31,930.2 1,771.879 4,482.172
2022-06-30 29,937.17 1,867.264 4,421.716
2022-03-31 28,008.72 2,075.035 3,932.323
2021-12-31 27,130.68 2,532.774 4,430.111
2021-09-30 25,523.01 2,606.322 4,122.38

LEN's Quality Factors

The “Quality” component of the POWR Ratings focuses on 31 different factors of a companies fundamentals and operational strength. Here are some key insights as we drill into the specifics of these quality attributes.
  • LEN has a Quality Grade of B, ranking ahead of 80.25% of graded US stocks.
  • LEN's asset turnover comes in at 0.82 -- ranking 42nd of 51 Construction stocks.
  • WLMS, BBU, and MHO are the stocks whose asset turnover ratios are most correlated with LEN.

The table below shows LEN's key quality metrics over time.

Period Asset Turnover Gross Margin ROIC
2021-08-31 0.820 0.192 0.174
2021-05-31 0.808 0.182 0.144
2021-02-28 0.783 0.169 0.130
2020-11-30 0.764 0.154 0.099
2020-08-31 0.773 0.142 0.089
2020-05-31 0.771 0.132 0.081

LEN Price Target

For more insight on analysts targets of LEN, see our LEN price target page. And for a list of of all stocks sorted by upside potential based on analyst target price, see our Top Price Target page.

Average Price Target $117.25 Average Broker Recommendation 1.59 (Moderate Buy)

Lennar Corp. CI A (LEN) Company Bio


Lennar Corporation is a home construction and real estate company based in FontainebleauFlorida, with a Miami postal address. In 2017, the company was the largest home construction company in the United States after its purchase of CalAtlantic Homes. The company is ranked 154th on the Fortune 500 as of 2019. The company operates in 21 states and owns Rialto Capital Management, the sponsor of six private equity funds that invest in real estate and an originator commercial mortgage loans for securitization. The company also developed and retains ownership interests in 53 apartment communities. The name Lennar is a portmanteau of the first names of two of the company's founders, Leonard Miller and Arnold Rosen. (Source:Wikipedia)


LEN Latest News Stream


Event/Time News Detail
Loading, please wait...

LEN Latest Social Stream


Loading social stream, please wait...

View Full LEN Social Stream

Latest LEN News From Around the Web

Below are the latest news stories about LENNAR CORP that investors may wish to consider to help them evaluate LEN as an investment opportunity.

Look Out! 3 Homebuilder Stocks Getting Ready to Shock the Market.

Homebuilder stocks, seemingly exempt from recent market corrections, might soon shock the market as lagging industry indicators catch up.

Jeremy Flint on InvestorPlace | May 30, 2023

Homebuilders Are Booming. There Are Two Big Reasons Why

Homebuilder shares have been some of the top-performing stocks of the past year. Five big builders—including D.R. Horton, Lennar and PulteGroup—are trading near record highs, even with Friday's rare declines.

Yahoo | May 19, 2023

How ‘Builder Incentives’ Can Get You a Deal in Today’s Tough Market

Anyone on the market for a new home knows the search can be a depressing one, marked by sky high prices, historically low inventory and mortgage rates that have doubled since last year. But easing...

Yahoo | May 18, 2023

7 Stocks to Sell if the Fed Keeps Raising Interest Rates

If the Federal Reserve decides to get really serious with interest rates, these would be the stocks to sell.

Josh Enomoto on InvestorPlace | May 17, 2023

Is the Tide Turning for Homebuilding ETFs?

The recent industry trends suggest that the pain is ultimately over from the home building ETF space.

Yahoo | May 17, 2023

Read More 'LEN' Stories Here

LEN Price Returns

1-mo -0.31%
3-mo 15.13%
6-mo 29.14%
1-year 42.04%
3-year 83.84%
5-year 126.27%
YTD 24.64%
2022 -20.64%
2021 53.99%
2020 37.97%
2019 42.96%
2018 -37.91%

LEN Dividends

Ex-Dividend Date Type Payout Amount Change
Loading, please wait...
View Full LEN Dividend History

Get Free Updates

Join thousands of investors who get the latest news, insights and top rated picks from StockNews.com!