
L3Harris Technologies Inc. (LHX): Price and Financial Metrics
LHX Price/Volume Stats
| Current price | $229.41 | 52-week high | $245.60 |
| Prev. close | $243.27 | 52-week low | $160.25 |
| Day low | $227.11 | Volume | 2,302,100 |
| Day high | $240.27 | Avg. volume | 995,747 |
| 50-day MA | $226.15 | Dividend yield | 1.93% |
| 200-day MA | $208.22 | Market Cap | 43.51B |
LHX Stock Price Chart Interactive Chart >
L3Harris Technologies Inc. (LHX) Company Bio
L3Harris Technologies (L3Harris) is an American technology company, defense contractor, and information technology services provider that produces C6ISR systems and products, wireless equipment, tactical radios, avionics and electronic systems, night vision equipment, and both terrestrial and spaceborne antennas for use in the government, defense, and commercial sectors. They specialize in surveillance solutions, microwave weaponry, and electronic warfare. It was formed from the merger of L3 Technologies (formerly L-3 Communications) and Harris Corporation on June 29, 2019, and was expected to be the sixth-largest defense contractor in the United States. (Source:Wikipedia)
Latest LHX News From Around the Web
Below are the latest news stories about L3HARRIS TECHNOLOGIES INC that investors may wish to consider to help them evaluate LHX as an investment opportunity.
L3Harris Technologies awarded $479M USSOCOM contractMore on L3Harris Technologies |
Triumph Group (TGI) to Sell Product-Support Business for $725MTriumph Group (TGI) is set to benefit from the divestiture of its Product Support business through debt reduction and better capital allocation. |
12 High Growth Dividend Paying Stocks To BuyIn this article, we discuss 12 high growth dividend stocks to buy. You can skip our detailed analysis of dividend stocks and their performance over the years, and go directly to read 5 High Growth Dividend Paying Stocks To Buy. Among some investors, there’s a perception or concern that allocating funds toward dividend payouts might […] |
20 Countries With Highest Military Spending In The WorldIn this article, we will be covering the 20 countries with highest military spending in the world. If you want to skip our detailed analysis of the global defense market, you can go directly to 5 Countries With Highest Military Spending In The World. Global Military Spending Reaches New Skies The global arms race is […] |
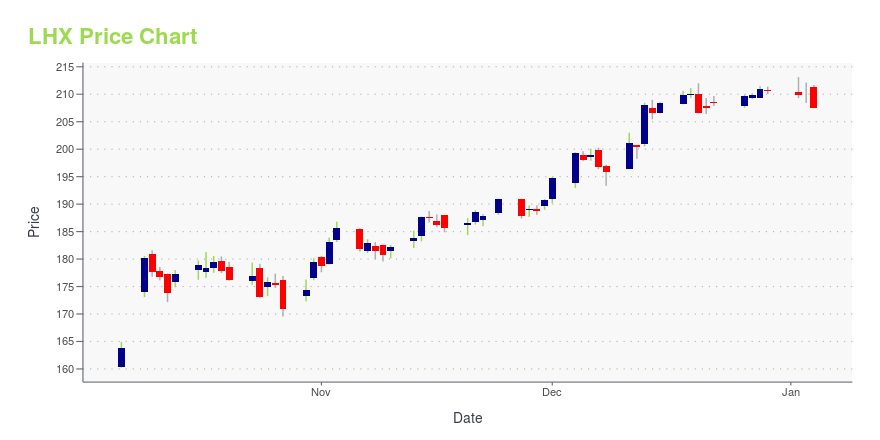
Why I Wouldn't Chase L3Harris HereThe company makes advanced military and commercial technologies, which seem to be more in demand as the world seems to be a dangerous place. In this daily bar chart of LHX, below, I can see that prices have broken above a ten-month downtrend line (not drawn) and have rallied above the bottoming 200-day moving average line. The trading volume has been more active the past three and a half months. |
LHX Price Returns
| 1-mo | 2.65% |
| 3-mo | 7.48% |
| 6-mo | 10.82% |
| 1-year | 23.71% |
| 3-year | 7.13% |
| 5-year | 26.64% |
| YTD | 10.07% |
| 2023 | 3.67% |
| 2022 | -0.48% |
| 2021 | 14.98% |
| 2020 | -2.76% |
| 2019 | 49.21% |
LHX Dividends
| Ex-Dividend Date | Type | Payout Amount | Change | ||||||
|---|---|---|---|---|---|---|---|---|---|
| Loading, please wait... | |||||||||
Loading social stream, please wait...