LivaNova PLC - Ordinary Shares (LIVN): Price and Financial Metrics
LIVN Price/Volume Stats
Current price | $43.83 | 52-week high | $70.57 |
Prev. close | $44.02 | 52-week low | $40.26 |
Day low | $43.66 | Volume | 237,700 |
Day high | $44.57 | Avg. volume | 500,459 |
50-day MA | $45.40 | Dividend yield | N/A |
200-day MA | $51.01 | Market Cap | 2.36B |
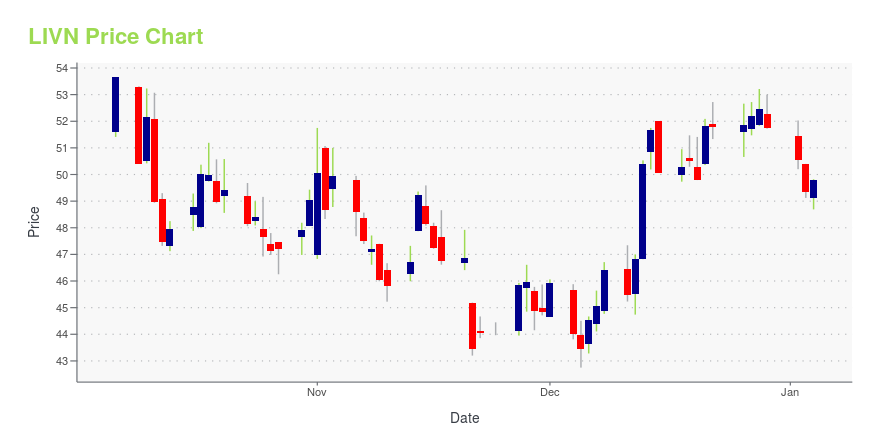
LIVN Stock Price Chart Interactive Chart >
LIVN POWR Grades
- LIVN scores best on the Growth dimension, with a Growth rank ahead of 94.36% of US stocks.
- LIVN's strongest trending metric is Value; it's been moving up over the last 179 days.
- LIVN's current lowest rank is in the Sentiment metric (where it is better than 22.39% of US stocks).
LIVN Stock Summary
- The price/operating cash flow metric for LIVANOVA PLC is higher than 89.16% of stocks in our set with a positive cash flow.
- With a year-over-year growth in debt of 16.25%, LIVANOVA PLC's debt growth rate surpasses 70.75% of about US stocks.
- In terms of twelve month growth in earnings before interest and taxes, LIVANOVA PLC is reporting a growth rate of -65.86%; that's higher than merely 20.93% of US stocks.
- If you're looking for stocks that are quantitatively similar to LIVANOVA PLC, a group of peers worth examining would be CARS, LFUS, EVCM, TWOU, and UEIC.
- LIVN's SEC filings can be seen here. And to visit LIVANOVA PLC's official web site, go to www.livanova.com.
LIVN Valuation Summary
- LIVN's price/sales ratio is 2.3; this is 4.55% higher than that of the median Healthcare stock.
- Over the past 92 months, LIVN's price/sales ratio has gone down 2.6.
Below are key valuation metrics over time for LIVN.
Stock | Date | P/S | P/B | P/E | EV/EBIT |
---|---|---|---|---|---|
LIVN | 2023-05-23 | 2.3 | 2 | -29.5 | -143.6 |
LIVN | 2023-05-22 | 2.4 | 2 | -30.0 | -146.3 |
LIVN | 2023-05-19 | 2.3 | 2 | -30.0 | -146.1 |
LIVN | 2023-05-18 | 2.3 | 2 | -29.6 | -144.3 |
LIVN | 2023-05-17 | 2.4 | 2 | -30.3 | -147.3 |
LIVN | 2023-05-16 | 2.4 | 2 | -30.7 | -149.6 |
LIVN Growth Metrics
- Its 2 year price growth rate is now at 40.38%.
- The 5 year net cashflow from operations growth rate now stands at -275.07%.
- Its 2 year revenue growth rate is now at -4.45%.

The table below shows LIVN's growth in key financial areas (numbers in millions of US dollars).
Date | Revenue | Operating Cash Flow | Net Income to Common Stock |
---|---|---|---|
2022-09-30 | 1,016.995 | 84.698 | -96.472 |
2022-06-30 | 1,017.605 | 73.013 | -31.365 |
2022-03-31 | 1,027.937 | 108.887 | -103.127 |
2021-12-31 | 1,035.365 | 102.544 | -135.818 |
2021-09-30 | 1,034.856 | 106.049 | -407.079 |
2021-06-30 | 1,021.724 | 90.753 | -379.614 |
LIVN's Quality Factors
The “Quality” component of the POWR Ratings focuses on 31 different factors of a companies fundamentals and operational strength. Here are some key insights as we drill into the specifics of these quality attributes.- LIVN has a Quality Grade of C, ranking ahead of 45.21% of graded US stocks.
- LIVN's asset turnover comes in at 0.441 -- ranking 110th of 186 Medical Equipment stocks.
- XRAY, PDEX, and ZBH are the stocks whose asset turnover ratios are most correlated with LIVN.
The table below shows LIVN's key quality metrics over time.
Period | Asset Turnover | Gross Margin | ROIC |
---|---|---|---|
2021-09-30 | 0.441 | 0.662 | -0.416 |
2021-06-30 | 0.421 | 0.653 | -0.308 |
2021-03-31 | 0.383 | 0.654 | -0.262 |
2020-12-31 | 0.378 | 0.662 | -0.271 |
2020-09-30 | 0.385 | 0.683 | -0.167 |
2020-06-30 | 0.397 | 0.690 | -0.156 |
LIVN Price Target
For more insight on analysts targets of LIVN, see our LIVN price target page. And for a list of of all stocks sorted by upside potential based on analyst target price, see our Top Price Target page.
Average Price Target | $100.71 | Average Broker Recommendation | 1.43 (Moderate Buy) |
LivaNova PLC - Ordinary Shares (LIVN) Company Bio
LivaNova PLC. offers cardiac surgery, cardiac rhythm management, and neuromodulation related products worldwide. The company was founded in 1987 and is based in London, England.
Latest LIVN News From Around the Web
Below are the latest news stories about LIVANOVA PLC that investors may wish to consider to help them evaluate LIVN as an investment opportunity.
David Einhorn’s 2023 Portfolio: Top 15 Stock PicksIn this piece, we will take a look at the top 15 stock picks of David Einhorn’s 2023 portfolio. For more stock picks, head on over to David Einhorn’s 2023 Portfolio: Top 5 Stock Picks. After the unexpected beating that investors and the stock market took in 2022, 2023 is turning out to be a […] |
LivaNova PLC's (NASDAQ:LIVN) Share Price Is Matching Sentiment Around Its RevenuesWith a price-to-sales (or "P/S") ratio of 2.4x LivaNova PLC ( NASDAQ:LIVN ) may be sending bullish signals at the... |
LivaNova (LIVN) Beats Q1 Earnings and Revenue EstimatesLivaNova (LIVN) delivered earnings and revenue surprises of 4.88% and 8.59%, respectively, for the quarter ended March 2023. Do the numbers hold clues to what lies ahead for the stock? |
LivaNova Reports First-Quarter 2023 ResultsLONDON, May 03, 2023--LivaNova PLC today reported results for the quarter ended March 31, 2023 and raised full-year 2023 guidance. |
The Returns On Capital At LivaNova (NASDAQ:LIVN) Don't Inspire ConfidenceWhen we're researching a company, it's sometimes hard to find the warning signs, but there are some financial metrics... |
LIVN Price Returns
1-mo | -8.50% |
3-mo | -5.60% |
6-mo | -21.96% |
1-year | N/A |
3-year | -18.06% |
5-year | -53.40% |
YTD | -21.08% |
2022 | -36.47% |
2021 | 32.05% |
2020 | -12.22% |
2019 | -17.54% |
2018 | 14.45% |
Continue Researching LIVN
Want to do more research on LivaNova PLC's stock and its price? Try the links below:LivaNova PLC (LIVN) Stock Price | Nasdaq
LivaNova PLC (LIVN) Stock Quote, History and News - Yahoo Finance
LivaNova PLC (LIVN) Stock Price and Basic Information | MarketWatch
Loading social stream, please wait...