Lowe's Companies, Inc. (LOW): Price and Financial Metrics
LOW Price/Volume Stats
Current price | $254.73 | 52-week high | $262.49 |
Prev. close | $253.33 | 52-week low | $181.85 |
Day low | $250.98 | Volume | 2,631,200 |
Day high | $255.29 | Avg. volume | 2,604,700 |
50-day MA | $232.73 | Dividend yield | 1.73% |
200-day MA | $219.03 | Market Cap | 145.75B |
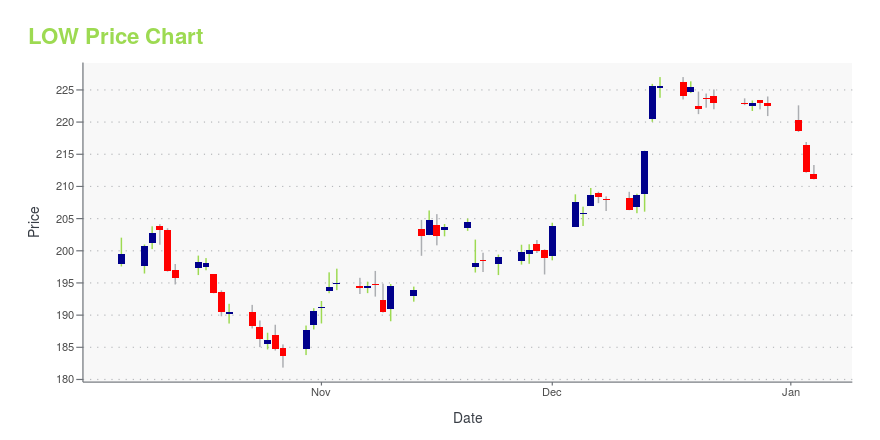
LOW Stock Price Chart Interactive Chart >
LOW POWR Grades
- LOW scores best on the Momentum dimension, with a Momentum rank ahead of 87.72% of US stocks.
- The strongest trend for LOW is in Sentiment, which has been heading down over the past 26 weeks.
- LOW's current lowest rank is in the Sentiment metric (where it is better than 13.84% of US stocks).
LOW Stock Summary
- LOW has a market capitalization of $122,079,151,602 -- more than approximately 98.09% of US stocks.
- The capital turnover (annual revenue relative to shareholder's equity) for LOW is -5.96 -- better than just 2.48% of US stocks.
- Equity multiplier, or assets relative to shareholders' equity, comes in at -3 for LOWES COMPANIES INC; that's greater than it is for only 4.54% of US stocks.
- If you're looking for stocks that are quantitatively similar to LOWES COMPANIES INC, a group of peers worth examining would be MDLZ, CVS, PM, BLK, and HDB.
- LOW's SEC filings can be seen here. And to visit LOWES COMPANIES INC's official web site, go to www.lowes.com.
LOW Valuation Summary
- LOW's price/sales ratio is 1.4; this is 75% higher than that of the median Consumer Cyclical stock.
- Over the past 243 months, LOW's price/sales ratio has gone down 0.
Below are key valuation metrics over time for LOW.
Stock | Date | P/S | P/B | P/E | EV/EBIT |
---|---|---|---|---|---|
LOW | 2023-12-29 | 1.4 | -8.4 | 16.7 | 14.4 |
LOW | 2023-12-28 | 1.4 | -8.5 | 16.7 | 14.4 |
LOW | 2023-12-27 | 1.4 | -8.5 | 16.7 | 14.4 |
LOW | 2023-12-26 | 1.4 | -8.5 | 16.7 | 14.4 |
LOW | 2023-12-22 | 1.4 | -8.5 | 16.7 | 14.4 |
LOW | 2023-12-21 | 1.4 | -8.5 | 16.8 | 14.5 |
LOW Growth Metrics
- Its 4 year net income to common stockholders growth rate is now at 62.59%.
- Its year over year net cashflow from operations growth rate is now at -22.48%.
- The 2 year net cashflow from operations growth rate now stands at 30.1%.
The table below shows LOW's growth in key financial areas (numbers in millions of US dollars).
Date | Revenue | Operating Cash Flow | Net Income to Common Stock |
---|---|---|---|
2022-09-30 | 95,953 | 9,072 | 6,686 |
2022-06-30 | 95,392 | 9,212 | 8,428 |
2022-03-31 | 95,486 | 8,598 | 8,454 |
2021-12-31 | 96,250 | 10,113 | 8,442 |
2021-09-30 | 95,221 | 8,743 | 8,213 |
2021-06-30 | 94,612 | 6,210 | 7,009 |
LOW's Quality Factors
The “Quality” component of the POWR Ratings focuses on 31 different factors of a companies fundamentals and operational strength. Here are some key insights as we drill into the specifics of these quality attributes.- LOW has a Quality Grade of B, ranking ahead of 86.36% of graded US stocks.
- LOW's asset turnover comes in at 1.909 -- ranking 54th of 165 Retail stocks.
- TCS, CONN, and BOOT are the stocks whose asset turnover ratios are most correlated with LOW.
The table below shows LOW's key quality metrics over time.
Period | Asset Turnover | Gross Margin | ROIC |
---|---|---|---|
2021-07-30 | 1.909 | 0.330 | 0.202 |
2021-04-30 | 1.881 | 0.331 | 0.204 |
2021-01-29 | 1.836 | 0.330 | 0.179 |
2020-10-30 | 1.816 | 0.329 | 0.170 |
2020-07-31 | 1.819 | 0.329 | 0.182 |
2020-05-01 | 1.788 | 0.322 | 0.148 |
LOW Price Target
For more insight on analysts targets of LOW, see our LOW price target page. And for a list of of all stocks sorted by upside potential based on analyst target price, see our Top Price Target page.
Average Price Target | $231.69 | Average Broker Recommendation | 1.44 (Moderate Buy) |
Lowe's Companies, Inc. (LOW) Company Bio
Lowe's Companies operates as a home improvement retailer, offering products for maintenance, repair, remodeling, and home decorating. The company was founded in 1946 and is based in Mooresville, North Carolina.
Latest LOW News From Around the Web
Below are the latest news stories about LOWES COMPANIES INC that investors may wish to consider to help them evaluate LOW as an investment opportunity.
Checkout Champs: 3 Retail Stocks Committed to Self-Service SuccessThere is a divide amongst retail stocks on whether self-checkout is good business. |
How To Earn $1,000 Per Month From Lowe's Cos. StockHome improvements product retailer Lowe’s Cos. Inc. (NYSE:LOW) stock closed at $225.59 at the end of trading hours on Dec. 15. The stock price is close to its 52-week high price of $237.205. The 52-week low price for the stock was $181.85. The company filed its Form 10-Q on Nov. 29 for the quarter from Aug. 4 to Nov. 3 on Nov. 3. According to the cash flow statement, dividend expenses for the quarter were $633 million. The cumulative dividend expense for the first three quarters of 2023 was $1.8 |
29 Undervalued Dividend Aristocrats: December 2023The S&P 500 Dividend Aristocrats Index contains 67 dividend growth stocks called the Dividend Aristocrats. |
3 Stocks That Hedge Funds Are Abandoning in DrovesStructural shifts in the financial markets have led to interesting strategic shifts among hedge fund managers. |
January Effect: 3 Under-the-Radar Stocks Poised for a New Year JumpAre you looking to profit from the January effect? |
LOW Price Returns
1-mo | 6.67% |
3-mo | 15.04% |
6-mo | 23.90% |
1-year | 34.97% |
3-year | 41.61% |
5-year | 154.72% |
YTD | 15.04% |
2023 | 14.03% |
2022 | -21.49% |
2021 | 63.34% |
2020 | 36.40% |
2019 | 32.23% |
LOW Dividends
Ex-Dividend Date | Type | Payout Amount | Change | ||||||
---|---|---|---|---|---|---|---|---|---|
Loading, please wait... |
Continue Researching LOW
Want to do more research on Lowes Companies Inc's stock and its price? Try the links below:Lowes Companies Inc (LOW) Stock Price | Nasdaq
Lowes Companies Inc (LOW) Stock Quote, History and News - Yahoo Finance
Lowes Companies Inc (LOW) Stock Price and Basic Information | MarketWatch
Loading social stream, please wait...