Lowe's Companies, Inc. (LOW): Price and Financial Metrics
LOW Price/Volume Stats
Current price | $210.61 | 52-week high | $237.21 |
Prev. close | $214.91 | 52-week low | $176.50 |
Day low | $210.18 | Volume | 2,959,600 |
Day high | $213.68 | Avg. volume | 2,836,183 |
50-day MA | $226.69 | Dividend yield | 2.02% |
200-day MA | $211.42 | Market Cap | 121.55B |
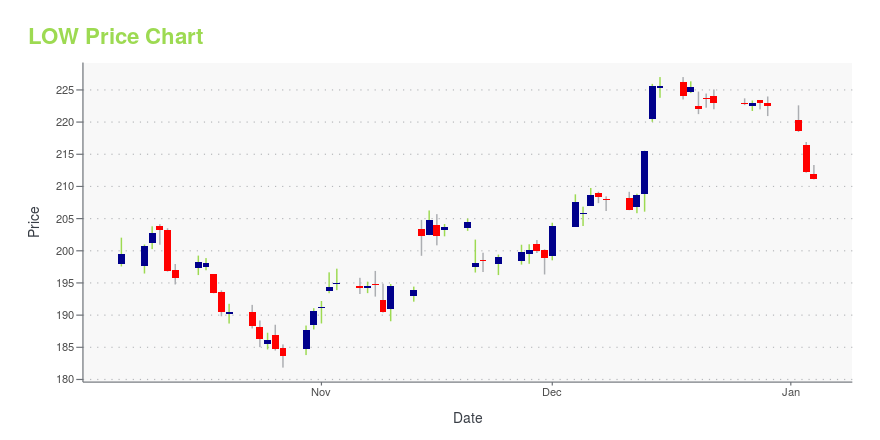
LOW Stock Price Chart Interactive Chart >
LOW POWR Grades
- Quality is the dimension where LOW ranks best; there it ranks ahead of 91.18% of US stocks.
- The strongest trend for LOW is in Quality, which has been heading up over the past 179 days.
- LOW's current lowest rank is in the Value metric (where it is better than 27.31% of US stocks).
LOW Stock Summary
- LOW has a higher market value than 98.4% of US stocks; more precisely, its current market capitalization is $125,649,525,481.
- LOWES COMPANIES INC's capital turnover -- a measure of revenue relative to shareholder's equity -- is better than just 2.43% of US listed stocks.
- LOW's equity multiplier -- a measure of assets relative to shareholders'equity -- is greater than that of just 4.22% of US stocks.
- Stocks that are quantitatively similar to LOW, based on their financial statements, market capitalization, and price volatility, are BKNG, HDB, ELV, AXP, and TJX.
- LOW's SEC filings can be seen here. And to visit LOWES COMPANIES INC's official web site, go to www.lowes.com.
LOW Valuation Summary
- In comparison to the median Consumer Cyclical stock, LOW's EV/EBIT ratio is 22.26% higher, now standing at 17.3.
- Over the past 243 months, LOW's price/sales ratio has gone down 0.1.
Below are key valuation metrics over time for LOW.
Stock | Date | P/S | P/B | P/E | EV/EBIT |
---|---|---|---|---|---|
LOW | 2023-09-13 | 1.4 | -9.0 | 21.8 | 17.3 |
LOW | 2023-09-12 | 1.4 | -9.0 | 22.0 | 17.4 |
LOW | 2023-09-11 | 1.4 | -9.1 | 22.1 | 17.4 |
LOW | 2023-09-08 | 1.4 | -9.1 | 22.1 | 17.4 |
LOW | 2023-09-07 | 1.4 | -9.2 | 22.3 | 17.5 |
LOW | 2023-09-06 | 1.4 | -9.0 | 21.9 | 17.3 |
LOW Growth Metrics
- Its 4 year net income to common stockholders growth rate is now at 62.59%.
- Its year over year net cashflow from operations growth rate is now at -22.48%.
- The 2 year net cashflow from operations growth rate now stands at 30.1%.

The table below shows LOW's growth in key financial areas (numbers in millions of US dollars).
Date | Revenue | Operating Cash Flow | Net Income to Common Stock |
---|---|---|---|
2022-09-30 | 95,953 | 9,072 | 6,686 |
2022-06-30 | 95,392 | 9,212 | 8,428 |
2022-03-31 | 95,486 | 8,598 | 8,454 |
2021-12-31 | 96,250 | 10,113 | 8,442 |
2021-09-30 | 95,221 | 8,743 | 8,213 |
2021-06-30 | 94,612 | 6,210 | 7,009 |
LOW's Quality Factors
The “Quality” component of the POWR Ratings focuses on 31 different factors of a companies fundamentals and operational strength. Here are some key insights as we drill into the specifics of these quality attributes.- LOW has a Quality Grade of B, ranking ahead of 86.36% of graded US stocks.
- LOW's asset turnover comes in at 1.909 -- ranking 54th of 165 Retail stocks.
- TCS, CONN, and BOOT are the stocks whose asset turnover ratios are most correlated with LOW.
The table below shows LOW's key quality metrics over time.
Period | Asset Turnover | Gross Margin | ROIC |
---|---|---|---|
2021-07-30 | 1.909 | 0.330 | 0.202 |
2021-04-30 | 1.881 | 0.331 | 0.204 |
2021-01-29 | 1.836 | 0.330 | 0.179 |
2020-10-30 | 1.816 | 0.329 | 0.170 |
2020-07-31 | 1.819 | 0.329 | 0.182 |
2020-05-01 | 1.788 | 0.322 | 0.148 |
LOW Price Target
For more insight on analysts targets of LOW, see our LOW price target page. And for a list of of all stocks sorted by upside potential based on analyst target price, see our Top Price Target page.
Average Price Target | $231.69 | Average Broker Recommendation | 1.44 (Moderate Buy) |
Lowe's Companies, Inc. (LOW) Company Bio
Lowe's Companies operates as a home improvement retailer, offering products for maintenance, repair, remodeling, and home decorating. The company was founded in 1946 and is based in Mooresville, North Carolina.
Latest LOW News From Around the Web
Below are the latest news stories about LOWES COMPANIES INC that investors may wish to consider to help them evaluate LOW as an investment opportunity.
Unveiling the Investment Potential of Lowe's Companies Inc (LOW): A Comprehensive AnalysisExploring the Financial Strength, Profitability, and Growth Metrics of Lowe's Companies Inc (LOW) |
4 Stocks to Watch in the Strong Retail Building Products IndustryDigital initiatives, continued innovation, and strong Pro and DIY demand have been aiding the Retail Building Products industry players. HD, LOW, FAST and BLDR are well-poised for growth. |
Pella's Popular Hidden Screen Expands to Lifestyle Series Wood Windows, Available Exclusively at Lowe'sPella Corporation's game-changing Hidden Screen innovation is now available to more customers, thanks to a partnership with Lowe's, the exclusive home improvement retailer of the Hidden Screen. Now offered on Pella's Lifestyle Series double-hung wood windows, Hidden Screen is currently available on Lowes.com and in over 1,700 Lowe's stores nationwide. |
Housing Market Crash Alert: The NAHB Just Issued a Key WarningIs a housing market crash imminent? |
Is It Time To Consider Buying Lowe's Companies, Inc. (NYSE:LOW)?Let's talk about the popular Lowe's Companies, Inc. ( NYSE:LOW ). The company's shares received a lot of attention from... |
LOW Price Returns
1-mo | -7.30% |
3-mo | -1.68% |
6-mo | 12.25% |
1-year | 14.25% |
3-year | 37.18% |
5-year | 97.14% |
YTD | 7.29% |
2022 | -21.49% |
2021 | 63.34% |
2020 | 36.40% |
2019 | 32.23% |
2018 | 1.22% |
LOW Dividends
Ex-Dividend Date | Type | Payout Amount | Change | ||||||
---|---|---|---|---|---|---|---|---|---|
Loading, please wait... |
Continue Researching LOW
Want to do more research on Lowes Companies Inc's stock and its price? Try the links below:Lowes Companies Inc (LOW) Stock Price | Nasdaq
Lowes Companies Inc (LOW) Stock Quote, History and News - Yahoo Finance
Lowes Companies Inc (LOW) Stock Price and Basic Information | MarketWatch
Loading social stream, please wait...