
Lam Research Corp. (LRCX): Price and Financial Metrics
LRCX Price/Volume Stats
| Current price | $894.64 | 52-week high | $1,130.00 |
| Prev. close | $884.12 | 52-week low | $574.42 |
| Day low | $889.04 | Volume | 1,167,822 |
| Day high | $908.66 | Avg. volume | 1,024,964 |
| 50-day MA | $1,003.81 | Dividend yield | 0.83% |
| 200-day MA | $863.20 | Market Cap | 116.97B |
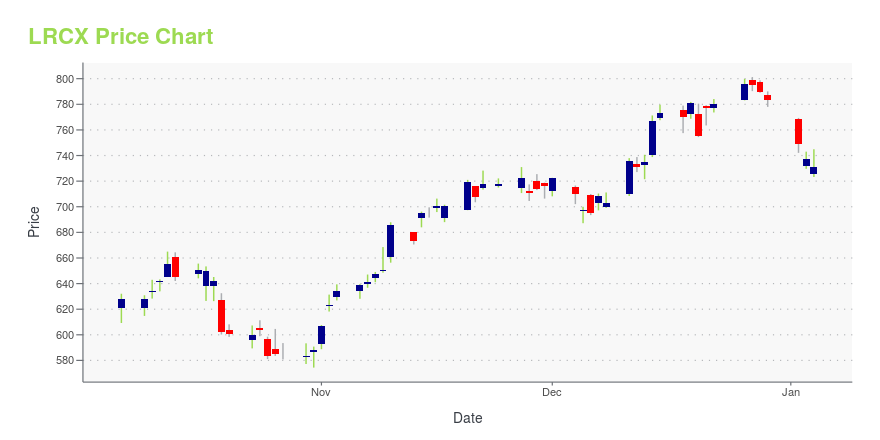
LRCX Stock Price Chart Interactive Chart >
Lam Research Corp. (LRCX) Company Bio
Lam Research Corporation is an American corporation that engages in the design, manufacture, marketing, and service of semiconductor processing equipment used in the fabrication of integrated circuits.[2] Its products are used primarily in front-end wafer processing, which involves the steps that create the active components of semiconductor devices (transistors, capacitors) and their wiring (interconnects). The company also builds equipment for back-end wafer-level packaging (WLP), and for related manufacturing markets such as for microelectromechanical systems (MEMS). (Source:Wikipedia)
Latest LRCX News From Around the Web
Below are the latest news stories about LAM RESEARCH CORP that investors may wish to consider to help them evaluate LRCX as an investment opportunity.
Fund manager's top growth stock picks for 2024As 2023 comes to a close, Clough Capital CEO and President Vince Lorusso discusses his top stock picks as we move into the new year. When discussing the funds he manages, Lorusso says, "There's really two different areas of investments. I kind of characterize them as stable growth companies, meaning they might be a little bit more defensive if we do have a little bit of a slowdown in the consumer." Lorusso's top picks for stable growth include Service Corporation International (SCI), Rollins, Inc. (ROL), and gold miners and utilities sectors. "In the other part of the portfolio, are these more dynamic growth companies that we think do have more beta potentially and are most exposed to some of the secular and also cyclical enthusiasm we're seeing around things like AI and EVs." Lorusso's... |
1 Top Chip Stock That Could Soar in 2024The memory chip market is making a big comeback, and this chip equipment company is ready to cash in. |
Best Growth Stocks 2024: 7 to Add to Your Must-Buy ListMany investors made it a point to avoid growth stocks after a disastrous 2022, but long-term investors were rewarded this year. |
Forever Favorites: 7 Dividend Stocks to Buy and Never SellSome investments just look after themselves. |
Lam Research (LRCX) Surpasses Market Returns: Some Facts Worth KnowingLam Research (LRCX) reachead $781.01 at the closing of the latest trading day, reflecting a +1.44% change compared to its last close. |
LRCX Price Returns
| 1-mo | -15.26% |
| 3-mo | -3.14% |
| 6-mo | 7.06% |
| 1-year | 28.70% |
| 3-year | 48.80% |
| 5-year | 353.03% |
| YTD | 14.68% |
| 2023 | 88.63% |
| 2022 | -40.72% |
| 2021 | 53.66% |
| 2020 | 64.18% |
| 2019 | 119.33% |
LRCX Dividends
| Ex-Dividend Date | Type | Payout Amount | Change | ||||||
|---|---|---|---|---|---|---|---|---|---|
| Loading, please wait... | |||||||||
Continue Researching LRCX
Want to see what other sources are saying about Lam Research Corp's financials and stock price? Try the links below:Lam Research Corp (LRCX) Stock Price | Nasdaq
Lam Research Corp (LRCX) Stock Quote, History and News - Yahoo Finance
Lam Research Corp (LRCX) Stock Price and Basic Information | MarketWatch
Loading social stream, please wait...