LSI Industries Inc. (LYTS): Price and Financial Metrics

LSI Industries Inc. (LYTS): $14.16

0.14 (-0.98%)

POWR Rating

Component Grades

Momentum

F

Stability

C

Sentiment

Quality

B

Add LYTS to Watchlist
Sign Up

Industry: Industrial - Equipment

Industry

C

Ranked

#8 of 87

in industry

LYTS Price/Volume Stats
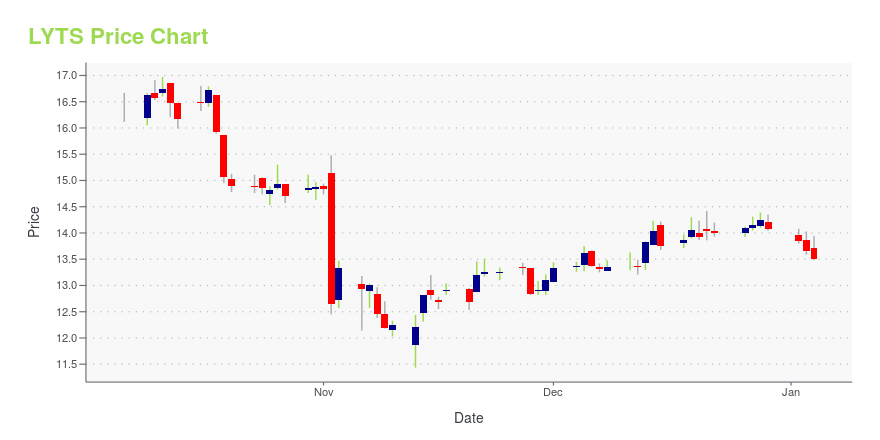
Current price $14.16 52-week high $16.97
Prev. close $14.30 52-week low $11.44
Day low $14.15 Volume 74,400
Day high $14.36 Avg. volume 117,468
50-day MA $14.03 Dividend yield 1.41%
200-day MA $13.86 Market Cap 411.63M

LYTS Stock Price Chart Interactive Chart >

LYTS POWR Grades

  • Value is the dimension where LYTS ranks best; there it ranks ahead of 96.55% of US stocks.
  • LYTS's strongest trending metric is Growth; it's been moving down over the last 26 weeks.
  • LYTS ranks lowest in Momentum; there it ranks in the 2nd percentile.

LYTS Stock Summary

  • Of note is the ratio of LSI INDUSTRIES INC's sales and general administrative expense to its total operating expenses; 86.87% of US stocks have a lower such ratio.
  • With a year-over-year growth in debt of -56.82%, LSI INDUSTRIES INC's debt growth rate surpasses merely 4.17% of about US stocks.
  • Shareholder yield, a measure of how much is returned to shareholders via dividends and share repurchases, for LYTS comes in at 12.7% -- higher than that of 86.92% of stocks in our set.
  • Stocks that are quantitatively similar to LYTS, based on their financial statements, market capitalization, and price volatility, are JAKK, APOG, HWKN, SCX, and CPSH.
  • LYTS's SEC filings can be seen here. And to visit LSI INDUSTRIES INC's official web site, go to www.lsi-industries.com.

LYTS Valuation Summary

  • In comparison to the median Technology stock, LYTS's price/earnings ratio is 47.47% lower, now standing at 14.
  • Over the past 243 months, LYTS's price/sales ratio has gone down 0.3.

Below are key valuation metrics over time for LYTS.

Stock Date P/S P/B P/E EV/EBIT
LYTS 2023-12-08 0.8 2.1 14.0 11.0
LYTS 2023-12-07 0.8 2.1 14.0 11.0
LYTS 2023-12-06 0.8 2.1 14.0 11.0
LYTS 2023-12-05 0.8 2.1 14.3 11.2
LYTS 2023-12-04 0.8 2.1 14.0 11.0
LYTS 2023-12-01 0.8 2.1 14.0 11.0

LYTS Growth Metrics

    Its 4 year net income to common stockholders growth rate is now at 139.58%.
  • Its year over year net income to common stockholders growth rate is now at 39.97%.
  • Its 3 year revenue growth rate is now at 28.4%.
Over the past 34 months, LYTS's revenue has gone up $169,843,000.

The table below shows LYTS's growth in key financial areas (numbers in millions of US dollars).

Date Revenue Operating Cash Flow Net Income to Common Stock
2022-12-31 493.453 32.742 21.473
2022-09-30 475.792 14.609 18.161
2022-06-30 455.12 -3.863 15.032
2022-03-31 424.666 -9.293 10.054
2021-12-31 386.759 -1.951 7.908
2021-09-30 352.003 12.481 7.011

LYTS's Quality Factors

The “Quality” component of the POWR Ratings focuses on 31 different factors of a companies fundamentals and operational strength. Here are some key insights as we drill into the specifics of these quality attributes.
  • LYTS has a Quality Grade of C, ranking ahead of 74.48% of graded US stocks.
  • LYTS's asset turnover comes in at 1.491 -- ranking 2nd of 53 Electrical Equipment stocks.
  • LFUS, OESX, and PPSI are the stocks whose asset turnover ratios are most correlated with LYTS.

The table below shows LYTS's key quality metrics over time.

Period Asset Turnover Gross Margin ROIC
2021-06-30 1.491 0.250 0.071
2021-03-31 1.540 0.255 0.093
2020-12-31 1.566 0.248 0.087
2020-09-30 1.586 0.244 0.075
2020-06-30 1.640 0.241 0.107
2020-03-31 1.672 0.232 0.080

LYTS Price Target

For more insight on analysts targets of LYTS, see our LYTS price target page. And for a list of of all stocks sorted by upside potential based on analyst target price, see our Top Price Target page.

Average Price Target $14.75 Average Broker Recommendation 1.5 (Moderate Buy)

LSI Industries Inc. (LYTS) Company Bio


LSI Industries Inc. provides corporate visual image solutions in the United States, Canada, Australia, Latin America, Europe, and the Middle East. It operates through Lighting, Graphics, and Technology segments. The company was founded in 1976 and is based in Cincinnati, Ohio.


LYTS Latest News Stream


Event/Time News Detail
Loading, please wait...

LYTS Latest Social Stream


Loading social stream, please wait...

View Full LYTS Social Stream

Latest LYTS News From Around the Web

Below are the latest news stories about LSI INDUSTRIES INC that investors may wish to consider to help them evaluate LYTS as an investment opportunity.

LSI Industries to Attend the 14th Annual Craig-Hallum Alpha Select Conference

CINCINNATI, November 09, 2023--LSI Industries Inc. (Nasdaq: LYTS, or the "Company"), a leading U.S. based manufacturer of commercial lighting and display solutions, today announced that Chief Executive Officer James Clark and Chief Financial Officer James Galeese will attend the 14th Annual Craig-Hallum Alpha Select Conference at the Sheraton Times Square Hotel in New York City on Thursday, November 16, 2023.

Yahoo | November 9, 2023

LSI Industries (NASDAQ:LYTS) Will Pay A Dividend Of $0.05

LSI Industries Inc. ( NASDAQ:LYTS ) has announced that it will pay a dividend of $0.05 per share on the 21st of...

Yahoo | November 6, 2023

LSI Industries Inc. (NASDAQ:LYTS) Q1 2024 Earnings Call Transcript

LSI Industries Inc. (NASDAQ:LYTS) Q1 2024 Earnings Call Transcript November 3, 2023 Operator: Greetings, and welcome to LSI Industries’ Fiscal First Quarter 2024 Results Conference Call. At this time, all participants are in a listen-only mode. A brief question-and-answer session will follow the formal presentation. [Operator Instructions] As a reminder, this conference is being recorded. […]

Yahoo | November 4, 2023

Q1 2024 LSI Industries Inc Earnings Call

Q1 2024 LSI Industries Inc Earnings Call

Yahoo | November 3, 2023

LSI Industries Inc (LYTS) Reports Fiscal 2024 First Quarter Results: 28% Increase in Net Income

Company declares a regular cash dividend of $0.05 per share

Yahoo | November 2, 2023

Read More 'LYTS' Stories Here

LYTS Price Returns

1-mo -0.14%
3-mo 2.09%
6-mo -5.62%
1-year 7.52%
3-year 75.70%
5-year 482.91%
YTD 0.93%
2023 16.79%
2022 82.88%
2021 -17.98%
2020 45.70%
2019 100.79%

LYTS Dividends

Ex-Dividend Date Type Payout Amount Change
Loading, please wait...
View Full LYTS Dividend History

Continue Researching LYTS

Here are a few links from around the web to help you further your research on Lsi Industries Inc's stock as an investment opportunity:

Lsi Industries Inc (LYTS) Stock Price | Nasdaq
Lsi Industries Inc (LYTS) Stock Quote, History and News - Yahoo Finance
Lsi Industries Inc (LYTS) Stock Price and Basic Information | MarketWatch

Get Free Updates

Join thousands of investors who get the latest news, insights and top rated picks from StockNews.com!