Mastercard Incorporated (MA): Price and Financial Metrics
MA Price/Volume Stats
Current price | $395.91 | 52-week high | $418.60 |
Prev. close | $399.44 | 52-week low | $276.87 |
Day low | $394.25 | Volume | 3,032,300 |
Day high | $402.18 | Avg. volume | 2,659,530 |
50-day MA | $402.55 | Dividend yield | 0.57% |
200-day MA | $377.89 | Market Cap | 373.03B |
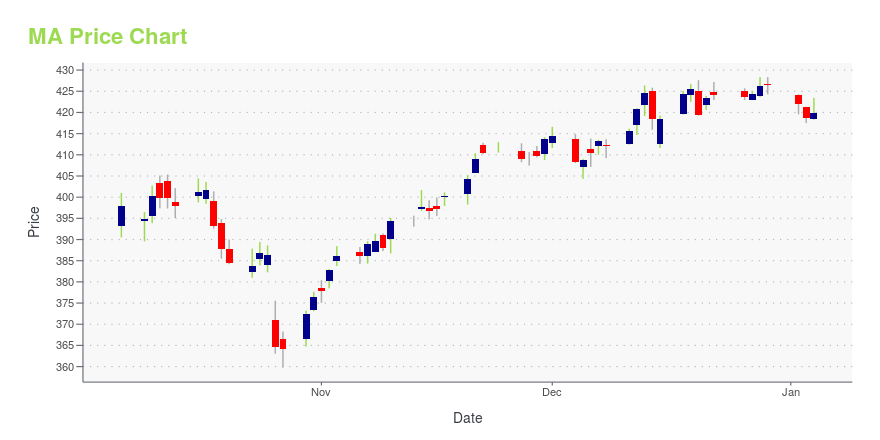
MA Stock Price Chart Interactive Chart >
MA POWR Grades
- Stability is the dimension where MA ranks best; there it ranks ahead of 93.97% of US stocks.
- MA's strongest trending metric is Momentum; it's been moving up over the last 177 days.
- MA's current lowest rank is in the Value metric (where it is better than 8.9% of US stocks).
MA Stock Summary
- MA has a market capitalization of $378,976,648,601 -- more than approximately 99.62% of US stocks.
- MA's price/sales ratio is 16.07; that's higher than the P/S ratio of 93.85% of US stocks.
- The volatility of MASTERCARD INC's share price is greater than that of merely 6.53% US stocks with at least 200 days of trading history.
- If you're looking for stocks that are quantitatively similar to MASTERCARD INC, a group of peers worth examining would be PG, JPM, WMT, UNH, and HD.
- Visit MA's SEC page to see the company's official filings. To visit the company's web site, go to www.mastercard.com.
MA Valuation Summary
- MA's price/sales ratio is 16.5; this is 617.39% higher than that of the median Financial Services stock.
- MA's price/sales ratio has moved up 15 over the prior 211 months.
Below are key valuation metrics over time for MA.
Stock | Date | P/S | P/B | P/E | EV/EBIT |
---|---|---|---|---|---|
MA | 2023-09-15 | 16.5 | 70.9 | 38.2 | 30.1 |
MA | 2023-09-14 | 16.5 | 70.8 | 38.1 | 30.0 |
MA | 2023-09-13 | 16.6 | 71.3 | 38.3 | 30.2 |
MA | 2023-09-12 | 16.6 | 71.3 | 38.3 | 30.2 |
MA | 2023-09-11 | 16.6 | 71.3 | 38.4 | 30.2 |
MA | 2023-09-08 | 16.6 | 71.0 | 38.2 | 30.1 |
MA Growth Metrics
- Its 3 year price growth rate is now at 49%.
- The 5 year net income to common stockholders growth rate now stands at 90.12%.
- Its year over year revenue growth rate is now at 28.8%.

The table below shows MA's growth in key financial areas (numbers in millions of US dollars).
Date | Revenue | Operating Cash Flow | Net Income to Common Stock |
---|---|---|---|
2022-09-30 | 21,636 | 11,284 | 9,784 |
2022-06-30 | 20,865 | 9,971 | 9,699 |
2022-03-31 | 19,896 | 9,782 | 9,490 |
2021-12-31 | 18,884 | 9,463 | 8,687 |
2021-09-30 | 17,788 | 8,527 | 8,093 |
2021-06-30 | 16,640 | 7,638 | 7,192 |
MA's Quality Factors
The “Quality” component of the POWR Ratings focuses on 31 different factors of a companies fundamentals and operational strength. Here are some key insights as we drill into the specifics of these quality attributes.- MA has a Quality Grade of C, ranking ahead of 67.3% of graded US stocks.
- MA's asset turnover comes in at 0.513 -- ranking 317th of 563 Business Services stocks.
- SABR, BGSF, and ACM are the stocks whose asset turnover ratios are most correlated with MA.
The table below shows MA's key quality metrics over time.
Period | Asset Turnover | Gross Margin | ROIC |
---|---|---|---|
2021-09-30 | 0.513 | 1 | 0.574 |
2021-06-30 | 0.493 | 1 | 0.534 |
2021-03-31 | 0.468 | 1 | 0.501 |
2020-12-31 | 0.478 | 1 | 0.499 |
2020-09-30 | 0.505 | 1 | 0.547 |
2020-06-30 | 0.550 | 1 | 0.637 |
MA Price Target
For more insight on analysts targets of MA, see our MA price target page. And for a list of of all stocks sorted by upside potential based on analyst target price, see our Top Price Target page.
Average Price Target | $438.51 | Average Broker Recommendation | 1.41 (Moderate Buy) |
Mastercard Incorporated (MA) Company Bio
Mastercard provides transaction processing, including authorization, clearing, and settlement, as well as delivers related products and services. The company was founded in 1966 and is based in Purchase, New York.
Latest MA News From Around the Web
Below are the latest news stories about MASTERCARD INC that investors may wish to consider to help them evaluate MA as an investment opportunity.
5 Top Stocks for OctoberVenture into October's investment landscape with our five experts, unveiling opportunities in an uneven market environment. |
Here's Why Mastercard Is One of My Favorite Stocks to Buy Right NowFool.com contributor Parkev Tatevosian explains his reasoning for why he likes Mastercard (NYSE: MA) stock so much. *Stock prices used were the afternoon prices of Sept. 27, 2023. The video was published on Sept. |
Is Visa a Buy?The world's leading payment processing is primed for sustained success and returning shareholder value. |
Where Will Mastercard Be in 3 Years?In the last three years, shares of Mastercard (NYSE: MA) are up just 19% (as of Sept. 26), a rate of return that has lagged both the S&P 500 and the Nasdaq Composite Index. If history is any indication, Mastercard will be a larger and more successful enterprise in three years. In recent years, the total payments volume that Mastercard processed, as well as its revenue and cards in circulation, have all climbed at healthy rates. |
Mastercard (MA) Boosts Payment Options for EV Drivers in EuropeMastercard (MA) teams up with Thuga and SMART/LAB to develop an innovative solution for enabling secure digital payments at EV charging stations. |
MA Price Returns
1-mo | -4.73% |
3-mo | N/A |
6-mo | 8.99% |
1-year | 40.11% |
3-year | 18.79% |
5-year | 82.37% |
YTD | 14.38% |
2022 | -2.66% |
2021 | 1.16% |
2020 | 20.19% |
2019 | 59.16% |
2018 | 25.31% |
MA Dividends
Ex-Dividend Date | Type | Payout Amount | Change | ||||||
---|---|---|---|---|---|---|---|---|---|
Loading, please wait... |
Continue Researching MA
Want to see what other sources are saying about Mastercard Inc's financials and stock price? Try the links below:Mastercard Inc (MA) Stock Price | Nasdaq
Mastercard Inc (MA) Stock Quote, History and News - Yahoo Finance
Mastercard Inc (MA) Stock Price and Basic Information | MarketWatch
Loading social stream, please wait...