Macerich Co. (MAC): Price and Financial Metrics
GET POWR RATINGS... FREE!
MAC POWR Grades
- MAC scores best on the Momentum dimension, with a Momentum rank ahead of 84.89% of US stocks.
- MAC's strongest trending metric is Momentum; it's been moving up over the last 179 days.
- MAC ranks lowest in Sentiment; there it ranks in the 1st percentile.
MAC Stock Summary
- MAC's current price/earnings ratio is 242.9, which is higher than 97.51% of US stocks with positive earnings.
- Of note is the ratio of Macerich Co's sales and general administrative expense to its total operating expenses; merely 4.35% of US stocks have a lower such ratio.
- For MAC, its debt to operating expenses ratio is greater than that reported by 95.94% of US equities we're observing.
- If you're looking for stocks that are quantitatively similar to Macerich Co, a group of peers worth examining would be EPR, CMRE, WTRG, BKH, and GLPI.
- Visit MAC's SEC page to see the company's official filings. To visit the company's web site, go to www.macerich.com.
MAC Valuation Summary
- MAC's price/sales ratio is 4.7; this is 176.47% higher than that of the median Real Estate stock.
- MAC's price/earnings ratio has moved down 35.1 over the prior 243 months.
Below are key valuation metrics over time for MAC.
Stock | Date | P/S | P/B | P/E | EV/EBIT |
---|---|---|---|---|---|
MAC | 2021-09-02 | 4.7 | 1.2 | -12.9 | -37.2 |
MAC | 2021-09-01 | 4.6 | 1.2 | -12.6 | -36.8 |
MAC | 2021-08-31 | 4.6 | 1.2 | -12.6 | -36.9 |
MAC | 2021-08-30 | 4.6 | 1.2 | -12.4 | -36.7 |
MAC | 2021-08-27 | 4.5 | 1.2 | -12.4 | -36.6 |
MAC | 2021-08-26 | 4.4 | 1.2 | -11.9 | -36.0 |
MAC Growth Metrics
- Its 5 year net cashflow from operations growth rate is now at -37.04%.
- Its 2 year cash and equivalents growth rate is now at 295.05%.
- The 4 year cash and equivalents growth rate now stands at 345.82%.

The table below shows MAC's growth in key financial areas (numbers in millions of US dollars).
Date | Revenue | Operating Cash Flow | Net Income to Common Stock |
---|---|---|---|
2021-12-31 | 847.437 | 286.368 | 14.263 |
2021-09-30 | 812.677 | 271.343 | -159.085 |
2021-06-30 | 786.384 | 253.246 | -287.978 |
2021-03-31 | 749.498 | 127.356 | -301.329 |
2020-12-31 | 786.026 | 124.837 | -230.203 |
2020-09-30 | 833.224 | 148.307 | -12.894 |
MAC's Quality Factors
The “Quality” component of the POWR Ratings focuses on 31 different factors of a companies fundamentals and operational strength. Here are some key insights as we drill into the specifics of these quality attributes.- MAC has a Quality Grade of D, ranking ahead of 12.74% of graded US stocks.
- MAC's asset turnover comes in at 0.086 -- ranking 245th of 444 Trading stocks.
- CLDT, AHT, and DRH are the stocks whose asset turnover ratios are most correlated with MAC.
The table below shows MAC's key quality metrics over time.
Period | Asset Turnover | Gross Margin | ROIC |
---|---|---|---|
2021-06-30 | 0.086 | 0.544 | -0.016 |
2021-03-31 | 0.080 | 0.533 | -0.016 |
2020-12-31 | 0.085 | 0.557 | -0.010 |
2020-09-30 | 0.091 | 0.580 | 0.007 |
2020-06-30 | 0.097 | 0.591 | 0.010 |
2020-03-31 | 0.103 | 0.605 | 0.014 |
MAC Price Target
For more insight on analysts targets of MAC, see our MAC price target page. And for a list of of all stocks sorted by upside potential based on analyst target price, see our Top Price Target page.
Average Price Target | $18.50 | Average Broker Recommendation | 2.09 (Hold) |
MAC Stock Price Chart Interactive Chart >
MAC Price/Volume Stats
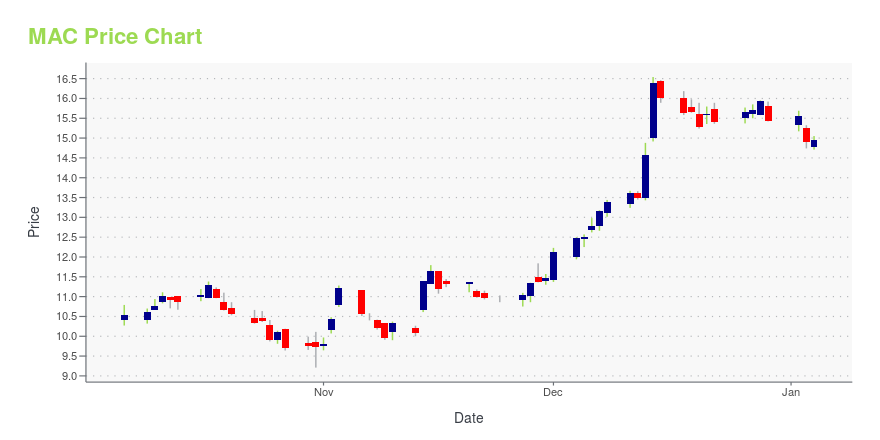
Current price | $11.47 | 52-week high | $22.88 |
Prev. close | $11.84 | 52-week low | $11.12 |
Day low | $11.12 | Volume | 4,122,500 |
Day high | $12.09 | Avg. volume | 3,204,372 |
50-day MA | $13.93 | Dividend yield | 5.23% |
200-day MA | $16.63 | Market Cap | 2.46B |
Macerich Co. (MAC) Company Bio
The Macerich Company engages in the acquisition, ownership, development, redevelopment, management and leasing of regional and community shopping centers located throughout the United States. The company was founded in 1964 and is based in Santa Monica, California.
Latest MAC News From Around the Web
Below are the latest news stories about Macerich Co that investors may wish to consider to help them evaluate MAC as an investment opportunity.
Macerich Company (The) – Consensus Indicates Potential 31.6% UpsideMacerich Company (The) with ticker code (MAC) now have 15 analysts covering the stock. The analyst consensus points to a rating of ''Hold''. The target price ranges between 35 and 14.75 with a mean TP of 21.05. Now with the previous closing price of 15.99 this would imply there is a potential upside of 31.6%. There is a 50 day moving average of 17.11 and the 200 day MA is 17.36. The company has a market cap of $3,509m. Visit the company website at: https://www.macerich.com [stock_market_widget type="chart" symbol="MAC" chart="bar" range="6mo" interval="1d" line-color="rgb(49, 125, 189)"] The potential market cap would be $4,619m based on the market concensus. Macerich is a fully integrated, self-managed and self-administered real estate investment trust, which focuses on the acquisition... |
Phoenix was one of the best-performing retail markets in 2021; experts think it will continue into 2022Whether it is the sales inside stores or the selling or leasing of retail buildings, 2021 was a good year for retail in Arizona. Here's what it means for the Valley's future. |
Macerich Earnings: The Mall REIT's Recovery ContinuesMacerich's financial results have already rebounded most of the way to pre-pandemic levels, and investors can expect further progress over the next few years. |
The Macerich Company Just Missed Earnings - But Analysts Have Updated Their ModelsInvestors in The Macerich Company ( NYSE:MAC ) had a good week, as its shares rose 3.7% to close at US$16.14 following... |
Macerich (MAC) Q4 FFO & Revenues Beat Estimates, Stock RisesMacerich's (MAC) fourth-quarter results reflect a better-than-expected top line. A surge in customer traffic acts as a positive and Macerich experiences a rise in the occupancy level. |
MAC Price Returns
1-mo | -13.67% |
3-mo | N/A |
6-mo | -45.16% |
1-year | -16.86% |
3-year | -63.08% |
5-year | -71.40% |
YTD | -32.18% |
2021 | 68.49% |
2020 | -54.09% |
2019 | -32.18% |
2018 | -30.56% |
2017 | -2.81% |
MAC Dividends
Ex-Dividend Date | Type | Payout Amount | Change | ||||||
---|---|---|---|---|---|---|---|---|---|
Loading, please wait... |
Continue Researching MAC
Want to see what other sources are saying about Macerich Co's financials and stock price? Try the links below:Macerich Co (MAC) Stock Price | Nasdaq
Macerich Co (MAC) Stock Quote, History and News - Yahoo Finance
Macerich Co (MAC) Stock Price and Basic Information | MarketWatch
Loading social stream, please wait...