
ManpowerGroup (MAN): Price and Financial Metrics
MAN Price/Volume Stats
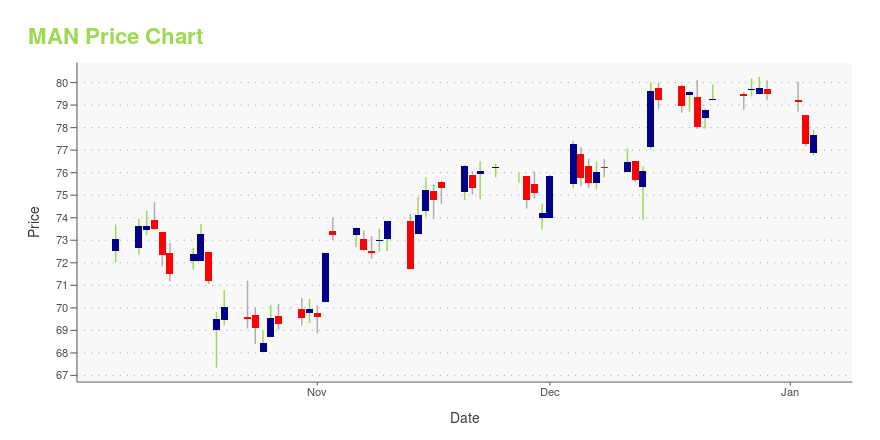
| Current price | $74.81 | 52-week high | $81.79 |
| Prev. close | $74.09 | 52-week low | $66.03 |
| Day low | $74.00 | Volume | 324,700 |
| Day high | $75.43 | Avg. volume | 408,227 |
| 50-day MA | $72.22 | Dividend yield | 4.28% |
| 200-day MA | $73.97 | Market Cap | 3.57B |
MAN Stock Price Chart Interactive Chart >
ManpowerGroup (MAN) Company Bio
Manpower Group Inc. provides workforce solutions and services in the Americas, Southern Europe, Northern Europe, and the Asia Pacific Middle East region. The companys recruitment service portfolio includes permanent, temporary, and contract recruitment of professionals, as well as administrative and industrial positions. The company was founded in 1948 and is based in Milwaukee, Wisconsin.
Latest MAN News From Around the Web
Below are the latest news stories about MANPOWERGROUP INC that investors may wish to consider to help them evaluate MAN as an investment opportunity.
Posthaste: Canadian employers are in a pickle — they plan to hire less but face record talent shortageOutlook for first quarter of 2024 moderates while need for skilled workers soars |
ManpowerGroup Inc.'s (NYSE:MAN) Has Performed Well But Fundamentals Look Varied: Is There A Clear Direction For The Stock?ManpowerGroup's (NYSE:MAN) stock is up by 3.6% over the past month. Given that the stock prices usually follow... |
Hiring Outlooks Continue to Moderate Post-Pandemic While Talent Shortages PersistEmployers anticipate measured hiring in the first quarter of 2024, while persistent talent shortages continue to impede hiring efforts, according to the latest ManpowerGroup (NYSE: MAN) Employment Outlook Survey. The research is based on data collected from more than 40,000 employers in 41 countries between October 1 to October 31, 2023. The Net Employment Outlook (NEO) for Q1 is 26%, up +3% year-over-year, but down -4% from last quarter. |
ManpowerGroup's Third Annual "Working to Change the World" ESG Report Highlights Progress for People and PlanetToday, ManpowerGroup (NYSE: MAN) released its 2022-2023 Environmental, Social, and Governance (ESG) report — Working to Change the World — citing a 32% reduction in direct emissions since 2019, continued progress in upskilling people for in-demand roles, and new commitments to preparing people for the greening world of work. The third annual report outlines ManpowerGroup's advancements across its strategic ESG pillars of Planet, People & Prosperity, and Principles of Governance. |
ManpowerGroup (MAN) Rises 9% in a Month: Here's What to KnowCommitment to shareholder returns makes ManpowerGroup (MAN) a reliable way for investors to compound wealth over the long term. |
MAN Price Returns
| 1-mo | 7.53% |
| 3-mo | 0.71% |
| 6-mo | -0.15% |
| 1-year | -2.22% |
| 3-year | -28.02% |
| 5-year | -4.84% |
| YTD | -3.88% |
| 2023 | -0.56% |
| 2022 | -11.79% |
| 2021 | 10.54% |
| 2020 | -4.53% |
| 2019 | 53.48% |
MAN Dividends
| Ex-Dividend Date | Type | Payout Amount | Change | ||||||
|---|---|---|---|---|---|---|---|---|---|
| Loading, please wait... | |||||||||
Continue Researching MAN
Want to do more research on ManpowerGroup Inc's stock and its price? Try the links below:ManpowerGroup Inc (MAN) Stock Price | Nasdaq
ManpowerGroup Inc (MAN) Stock Quote, History and News - Yahoo Finance
ManpowerGroup Inc (MAN) Stock Price and Basic Information | MarketWatch
Loading social stream, please wait...