
Matson, Inc. (MATX): Price and Financial Metrics
MATX Price/Volume Stats
| Current price | $130.36 | 52-week high | $133.88 |
| Prev. close | $127.90 | 52-week low | $82.68 |
| Day low | $127.05 | Volume | 292,300 |
| Day high | $130.59 | Avg. volume | 267,494 |
| 50-day MA | $124.55 | Dividend yield | 0.99% |
| 200-day MA | $110.37 | Market Cap | 4.55B |
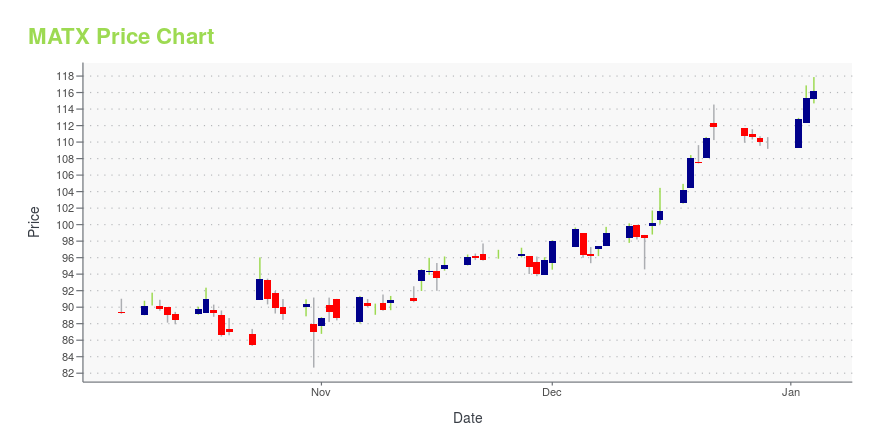
MATX Stock Price Chart Interactive Chart >
Matson, Inc. (MATX) Company Bio
Mattson Inc. operates as an ocean freight carrier in the Pacific. It operates in two segments, Ocean Transportation and Logistics. The company was founded in 1882 and is based in Honolulu, Hawaii.
Latest MATX News From Around the Web
Below are the latest news stories about MATSON INC that investors may wish to consider to help them evaluate MATX as an investment opportunity.
As Trouble on the High Seas Slows Global Commerce, Consider Trading MatsonMatson has no exposure to Europe, the Middle East, the Suez Canal, and the Red Sea, yet will benefit from rates on the way up. |
3 Transport-Service Stocks to Watch Amid Industry HiccupsThe Zacks Industry Rank for the Transportation-Services industry paints a dull picture mainly owing to the slowdown in freight demand. We believe stocks like EXPD, CHRW and MATX are better positioned to escape industry challenges. |
What Makes Matson (MATX) a Good Investment?Meridian Funds, managed by ArrowMark Partners, released its “Meridian Growth Fund” third quarter 2023 investor letter. A copy of the same can be downloaded here. In the third quarter, the fund returned -9.91% (net) compared to a -6.84% return for the Russell 2500 Growth Index. The firm’s investment process prioritizes the management of risk over the […] |
Are Transportation Stocks Lagging Matson (MATX) This Year?Here is how Matson (MATX) and Old Dominion Freight Line (ODFL) have performed compared to their sector so far this year. |
MATSON TO PARTICIPATE AT STEPHENS 2023 ANNUAL INVESTMENT CONFERENCEMatson, Inc. (NYSE: MATX) announced today that Joel Wine, Executive Vice President and Chief Financial Officer, will present an overview of the Company and respond to questions at the Stephens 2023 Annual Investment Conference to be held on November 14, 2023 in Nashville, Tennessee. |
MATX Price Returns
| 1-mo | 1.09% |
| 3-mo | 20.01% |
| 6-mo | 15.08% |
| 1-year | 40.95% |
| 3-year | 110.62% |
| 5-year | 249.91% |
| YTD | 19.62% |
| 2023 | 78.19% |
| 2022 | -29.53% |
| 2021 | 60.35% |
| 2020 | 43.05% |
| 2019 | 30.32% |
MATX Dividends
| Ex-Dividend Date | Type | Payout Amount | Change | ||||||
|---|---|---|---|---|---|---|---|---|---|
| Loading, please wait... | |||||||||
Continue Researching MATX
Want to see what other sources are saying about Matson Inc's financials and stock price? Try the links below:Matson Inc (MATX) Stock Price | Nasdaq
Matson Inc (MATX) Stock Quote, History and News - Yahoo Finance
Matson Inc (MATX) Stock Price and Basic Information | MarketWatch
Loading social stream, please wait...