
McKesson Corp. (MCK): Price and Financial Metrics
MCK Price/Volume Stats
| Current price | $600.16 | 52-week high | $612.17 |
| Prev. close | $595.73 | 52-week low | $395.30 |
| Day low | $594.03 | Volume | 634,053 |
| Day high | $603.17 | Avg. volume | 700,717 |
| 50-day MA | $581.23 | Dividend yield | 0.42% |
| 200-day MA | $515.73 | Market Cap | 77.98B |
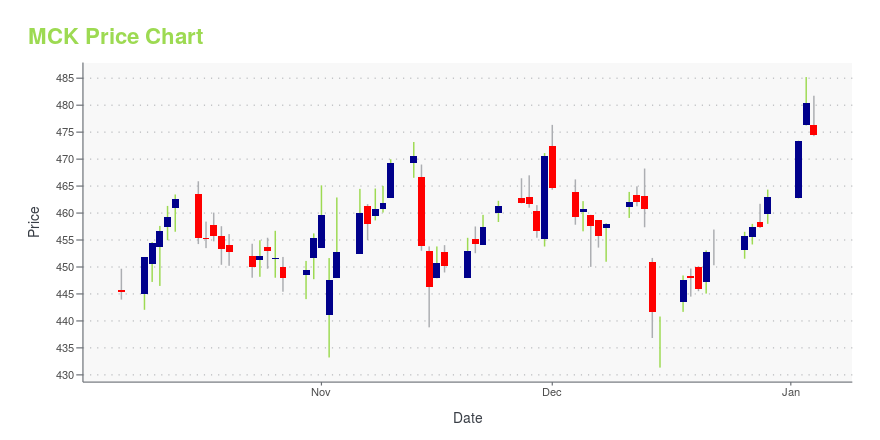
MCK Stock Price Chart Interactive Chart >
McKesson Corp. (MCK) Company Bio
McKesson Corporation is an American company distributing pharmaceuticals and providing health information technology, medical supplies, and care management tools. The company delivers a third of all pharmaceuticals used in North America and employs over 78,000 employees. McKesson had revenues of $238.2 billion in its fiscal year ending March 31, 2021. (Source:Wikipedia)
Latest MCK News From Around the Web
Below are the latest news stories about MCKESSON CORP that investors may wish to consider to help them evaluate MCK as an investment opportunity.
Silver Economy Successes: 3 Stocks Benefitting From an Aging PopulationExplore our in-depth analysis of aging population stocks, uncovering the opportunities and challenges in this sector. |
McKesson Corporation Announces Third Quarter Fiscal 2024 Earnings Release Date and Participation in January ConferenceIRVING, Texas, December 27, 2023--McKesson Corporation (NYSE: MCK) will release its third quarter fiscal 2024 financial results after market close on Wednesday, February 7, 2024. The company will host a live webcast of the earnings conference call for investors at 4:30 PM Eastern Time to review its financial results. |
McKesson (MCK) Announces Availability of PNH's FDA-Approved DrugThe availability of the FDA-approved drug via McKesson's (MCK) independent specialty pharmacy is expected to give patients more treatment options for PNH. |
McKesson's (NYSE:MCK) five-year earnings growth trails the 34% YoY shareholder returnsFor many, the main point of investing in the stock market is to achieve spectacular returns. And we've seen some truly... |
Why McKesson (MCK) is a Top Value Stock for the Long-TermThe Zacks Style Scores offers investors a way to easily find top-rated stocks based on their investing style. Here's why you should take advantage. |
MCK Price Returns
| 1-mo | 0.10% |
| 3-mo | 10.71% |
| 6-mo | 24.09% |
| 1-year | 48.92% |
| 3-year | 199.84% |
| 5-year | 349.78% |
| YTD | 30.07% |
| 2023 | 24.13% |
| 2022 | 51.82% |
| 2021 | 44.23% |
| 2020 | 27.06% |
| 2019 | 26.72% |
MCK Dividends
| Ex-Dividend Date | Type | Payout Amount | Change | ||||||
|---|---|---|---|---|---|---|---|---|---|
| Loading, please wait... | |||||||||
Continue Researching MCK
Here are a few links from around the web to help you further your research on Mckesson Corp's stock as an investment opportunity:Mckesson Corp (MCK) Stock Price | Nasdaq
Mckesson Corp (MCK) Stock Quote, History and News - Yahoo Finance
Mckesson Corp (MCK) Stock Price and Basic Information | MarketWatch
Loading social stream, please wait...