
Mercury General Corporation (MCY): Price and Financial Metrics
MCY Price/Volume Stats
| Current price | $58.14 | 52-week high | $59.89 |
| Prev. close | $56.66 | 52-week low | $27.27 |
| Day low | $57.15 | Volume | 164,665 |
| Day high | $58.19 | Avg. volume | 213,655 |
| 50-day MA | $54.80 | Dividend yield | 2.19% |
| 200-day MA | $45.84 | Market Cap | 3.22B |
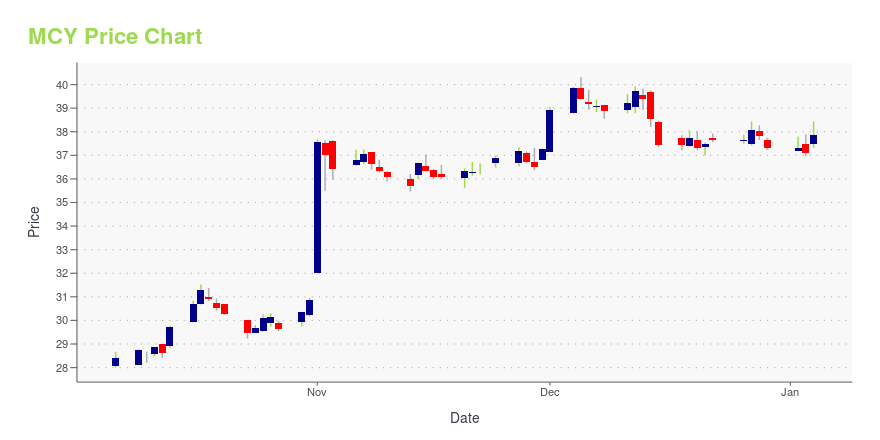
MCY Stock Price Chart Interactive Chart >
Mercury General Corporation (MCY) Company Bio
Mercury General Corporation writes personal automobile insurance, homeowners, commercial automobile, commercial property, mechanical breakdown, fire, and umbrella insurance. The company was founded in 1960 and is based in Los Angeles, California.
Latest MCY News From Around the Web
Below are the latest news stories about MERCURY GENERAL CORP that investors may wish to consider to help them evaluate MCY as an investment opportunity.
15 Best Earthquake Insurance Companies Heading into 2024In this article, we will look into the 15 best earthquake insurance companies heading into 2024. If you want to skip our detailed analysis, you can go directly to the 5 Best Earthquake Insurance Companies Heading into 2024. Why Do You Need Earthquake Insurance? Earthquake insurance covers both life and non-life insurance, depending on the […] |
Mercury Insurance Partners with LA Kings to Bring First-of-Their-Kind Experiences to FansMercury Insurance and the Los Angeles Kings announced today that the two longtime partners have teamed up to create a first-of-its-kind augmented reality (AR) experience that will send fans on a fanciful adventure through some of LA's most recognized landmarks in search of Kings' mascot and hockey's most lovable lion, Bailey. |
Mercury Insurance Offers Winter Safety Guide to Navigate Rain and SnowWinter road trips can be an exciting adventure, yet they are not without risks. Drivers must remain vigilant and prepared for any potential hazards such as rain, snow, ice, wind, or the combination of all four. |
Mercury Insurance Offers Home Safety Tips to Keep the Holiday Season Merry and BrightThe holiday season is a time for gathering with friends and family to celebrate traditions, create lasting memories, and carry the joy of the festivities into the new year. However, the holidays can also pose a unique set of challenges for homeowners as they prepare to host guests or visit loved ones out of town. To keep your celebrations safe, joyful and bright, Mercury Insurance (NYSE: MCY) has put together a series of home safety tips to keep in mind when planning holiday festivities. |
Victor Joseph Promoted to President & Chief Operating Officer of Mercury General CorporationMercury General Corporation (NYSE: MCY) announced today that Victor Joseph has been named President & Chief Operating Officer and has also been appointed to the Company's board of directors, effective January 1, 2024. Victor is currently Mercury's Executive Vice President & Chief Operating Officer, a position he has held since 2022. He will continue to report directly to Gabriel Tirador, Mercury's Chief Executive Officer. |
MCY Price Returns
| 1-mo | 12.46% |
| 3-mo | 13.23% |
| 6-mo | 42.34% |
| 1-year | 92.28% |
| 3-year | 6.96% |
| 5-year | 16.87% |
| YTD | 57.83% |
| 2023 | 13.58% |
| 2022 | -32.61% |
| 2021 | 6.17% |
| 2020 | 13.43% |
| 2019 | -1.23% |
MCY Dividends
| Ex-Dividend Date | Type | Payout Amount | Change | ||||||
|---|---|---|---|---|---|---|---|---|---|
| Loading, please wait... | |||||||||
Continue Researching MCY
Want to do more research on Mercury General Corp's stock and its price? Try the links below:Mercury General Corp (MCY) Stock Price | Nasdaq
Mercury General Corp (MCY) Stock Quote, History and News - Yahoo Finance
Mercury General Corp (MCY) Stock Price and Basic Information | MarketWatch
Loading social stream, please wait...