MDU Resources Group Inc. (MDU): Price and Financial Metrics
MDU Stock Summary
- MDU's went public 33.33 years ago, making it older than 90.54% of listed US stocks we're tracking.
- Of note is the ratio of Mdu Resources Group Inc's sales and general administrative expense to its total operating expenses; just 0.48% of US stocks have a lower such ratio.
- The volatility of Mdu Resources Group Inc's share price is greater than that of only 16.04% US stocks with at least 200 days of trading history.
- If you're looking for stocks that are quantitatively similar to Mdu Resources Group Inc, a group of peers worth examining would be NOMD, TAC, PAC, OGE, and PK.
- MDU's SEC filings can be seen here. And to visit Mdu Resources Group Inc's official web site, go to www.mdu.com.
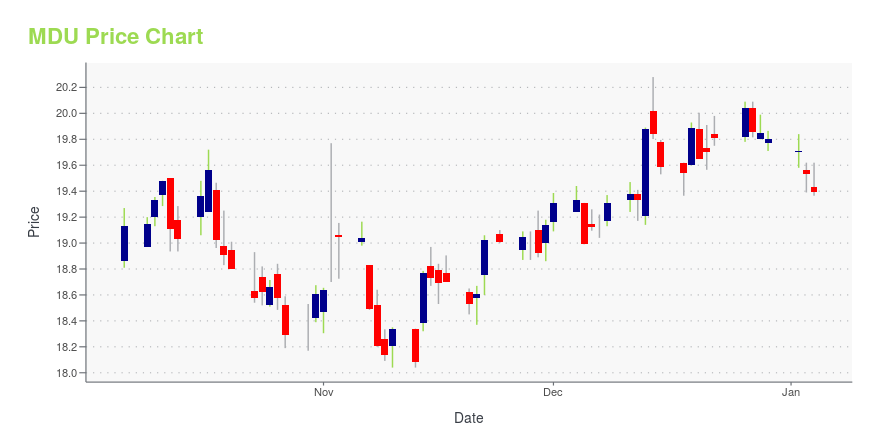
MDU Stock Price Chart Interactive Chart >
MDU Price/Volume Stats
Current price | $28.56 | 52-week high | $30.55 |
Prev. close | $28.52 | 52-week low | $15.00 |
Day low | $28.21 | Volume | 273,144 |
Day high | $28.81 | Avg. volume | 943,558 |
50-day MA | $27.05 | Dividend yield | 2.98% |
200-day MA | $23.99 | Market Cap | 5.73B |
MDU Resources Group Inc. (MDU) Company Bio
MDU Resources Group provides value-added natural resource products and related services that are essential to energy and transportation infrastructure, including regulated utilities and pipelines, construction materials and services, and exploration and production. The company was founded in 1924 and is based in Bismarck, North Dakota.
MDU Price Forecast Based on DCF Valuation
Current Price | DCF Fair Value Target: | Forecasted Gain: |
$28.56 | $35.4 | 24% |
The table below illustrates the output of a discounted cash flow forecast using a variety of scenarios for Mdu Resources Group Inc. To summarize, we found that Mdu Resources Group Inc ranked in the 58th percentile in terms of potential gain offered. More precisely, our analysis suggests the stock is undervalued by approximately 24.83% on a DCF basis. In terms of the factors that were most noteworthy in this DCF analysis for MDU, they are:
- The company's compound free cash flow growth rate over the past 5.01 years comes in at 0.28%; that's greater than 66.39% of US stocks we're applying DCF forecasting to.
- Mdu Resources Group Inc's weighted average cost of capital (WACC) is 8%; for context, that number is higher than merely 7.98% of tickers in our DCF set.
- Relative to other stocks in its sector (Basic Materials), Mdu Resources Group Inc has a reliance on debt greater than 61.91% of them.
Terminal Growth Rate in Free Cash Flow | Return Relative to Current Share Price |
0% | 22% |
1% | 23% |
2% | 24% |
3% | 25% |
4% | 27% |
5% | 28% |
Want more companies with a valuation profile/forecast similar to that of Mdu Resources Group Inc? See FF, VHI, CRH, USAP, and FMC.
Latest MDU News From Around the Web
Below are the latest news stories about Mdu Resources Group Inc that investors may wish to consider to help them evaluate MDU as an investment opportunity.
MDU Resources Group (NYSE:MDU) Has Compensated Shareholders With A Respectable 82% Return On Their InvestmentThe main point of investing for the long term is to make money. Better yet, you'd like to see the share price move up... |
MDU Resources Declares Quarterly Dividend on Common StockMDU Resources Group, Inc.'s (NYSE: MDU) board of directors today declared a quarterly dividend on the company's common stock of 21.25 cents per share, unchanged from the previous quarter. |
MDU Resources Group, Inc. 2020 Q4 - Results - Earnings Call PresentationThe following slide deck was published by MDU Resources Group, Inc. in conjunction with their 2020 Q4 earnings call.... |
MDU Resources Group, Inc. (MDU) CEO Dave Goodin on Q4 2020 Results - Earnings Call TranscriptMDU Resources Group, Inc. (MDU) Q4 2020 Results Earnings Conference Call February 04, 2021, 02:00 PM ET Company Participants Jason Vollmer - VP, CFO and Treasurer Dave Goodin - President and CEO Dave Barney - President and CEO, Knife River Corporation Jeff Thiede - President and CEO, MDU Construction Services... |
Are You Looking for a High-Growth Dividend Stock? MDU Resources (MDU) Could Be a Great ChoiceDividends are one of the best benefits to being a shareholder, but finding a great dividend stock is no easy task. Does MDU Resources (MDU) have what it takes? Let's find out. |
MDU Price Returns
1-mo | 8.80% |
3-mo | 12.97% |
6-mo | 22.68% |
1-year | 1.22% |
3-year | 17.89% |
5-year | 83.30% |
YTD | 8.43% |
2020 | -8.31% |
2019 | 28.44% |
2018 | -8.63% |
2017 | -3.87% |
2016 | 62.28% |
MDU Dividends
Ex-Dividend Date | Type | Payout Amount | Change | ||||||
---|---|---|---|---|---|---|---|---|---|
Loading, please wait... |
Continue Researching MDU
Want to do more research on Mdu Resources Group Inc's stock and its price? Try the links below:Mdu Resources Group Inc (MDU) Stock Price | Nasdaq
Mdu Resources Group Inc (MDU) Stock Quote, History and News - Yahoo Finance
Mdu Resources Group Inc (MDU) Stock Price and Basic Information | MarketWatch
Get Free Updates
Join thousands of investors who get the latest news, insights and top rated picks from StockNews.com!
Loading social stream, please wait...