
MFA Financial, Inc. (MFA): Price and Financial Metrics
MFA Price/Volume Stats
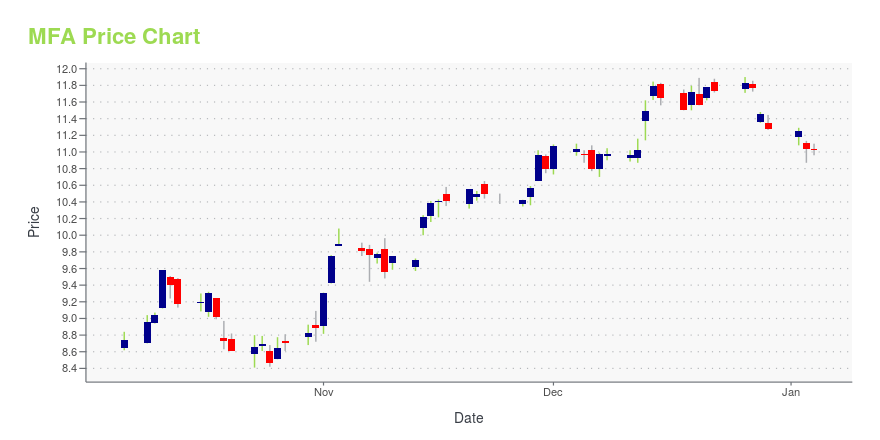
| Current price | $11.16 | 52-week high | $11.90 |
| Prev. close | $10.96 | 52-week low | $8.41 |
| Day low | $11.08 | Volume | 604,100 |
| Day high | $11.24 | Avg. volume | 701,471 |
| 50-day MA | $10.88 | Dividend yield | 12.19% |
| 200-day MA | $10.78 | Market Cap | 1.14B |
MFA Stock Price Chart Interactive Chart >
MFA Financial, Inc. (MFA) Company Bio
MFA Financial, Inc. is a real estate investment trust (REIT) which invests in residential agency and non-agency mortgage-backed securities (MBS), and residential whole loans in the United States (the U.S.). Its MBS are secured by hybrid mortgages, adjustable-rate mortgages, and 15-year and longer term fixed-rate mortgages, as well as by mortgages that have interest rates that reset more frequently. The company was founded in 1997 and is based in New York City, New York.
Latest MFA News From Around the Web
Below are the latest news stories about MFA FINANCIAL INC that investors may wish to consider to help them evaluate MFA as an investment opportunity.
Zacks Industry Outlook Highlights Ladder Capital, MFA Financial and ACRES Commercial RealtyLadder Capital, MFA Financial and ACRES Commercial Realty have been highlighted in this Industry Outlook article. |
3 mREIT Stocks to Buy Despite Unsettling Mortgage MarketHigh rates, credit spread volatility, spread widening and yield curve inversion challenge the Zacks REIT and Equity Trust industry. Amid this, LADR, MFA and ACR are poised to navigate industry hiccups. |
MFA Financial, Inc. Announces Appointment of Bryan Doran as Chief Accounting OfficerNEW YORK, December 14, 2023--MFA Financial, Inc. (NYSE: MFA) announced today that it has appointed Bryan Doran to the position of Chief Accounting Officer. In his new role, Mr. Doran will work closely with MFA’s Chief Financial Officer, Michael Roper, to help oversee financial reporting and other accounting matters at the company. |
Analyst Initiates Coverage On 8 Mortgage REITsWhen analysts initiate coverage on a stock, it means they will begin to provide research on it and make investment recommendations for it for the first time. It typically leads to an increase in trading volume and interest among investors. It can help shares of those stocks to move higher. Typically, analysts initiate coverage on two or three similar stocks at a time. But consider this somewhat unusual scenario where a single analyst initiated coverage on eight different mortgage real estate inv |
Analysts Slashing Price Targets During A Quiet WeekThanksgiving week is usually quiet yet positive for stocks, and 2023 was no exception. Still, despite recent gains in the real estate investment trust (REIT) sector, analysts were busy sharpening their Thanksgiving knives this week on the price targets of several REITs. Take a look at four REITs whose current ratings were maintained this week but still experienced significant carvings on their price targets. NetSTREIT Corp. (NYSE:NTST) is a Dallas-based retail REIT with 547 properties across 45 |
MFA Price Returns
| 1-mo | 5.78% |
| 3-mo | 7.46% |
| 6-mo | 3.09% |
| 1-year | 10.70% |
| 3-year | -3.39% |
| 5-year | -20.99% |
| YTD | 5.56% |
| 2023 | 30.66% |
| 2022 | -31.75% |
| 2021 | 27.71% |
| 2020 | -40.87% |
| 2019 | 27.54% |
MFA Dividends
| Ex-Dividend Date | Type | Payout Amount | Change | ||||||
|---|---|---|---|---|---|---|---|---|---|
| Loading, please wait... | |||||||||
Continue Researching MFA
Want to see what other sources are saying about Mfa Financial Inc's financials and stock price? Try the links below:Mfa Financial Inc (MFA) Stock Price | Nasdaq
Mfa Financial Inc (MFA) Stock Quote, History and News - Yahoo Finance
Mfa Financial Inc (MFA) Stock Price and Basic Information | MarketWatch
Loading social stream, please wait...