
Magna International Inc. (MGA): Price and Financial Metrics
MGA Price/Volume Stats
| Current price | $43.53 | 52-week high | $65.27 |
| Prev. close | $43.23 | 52-week low | $40.83 |
| Day low | $42.90 | Volume | 1,087,401 |
| Day high | $43.66 | Avg. volume | 1,564,232 |
| 50-day MA | $43.96 | Dividend yield | 4.34% |
| 200-day MA | $51.10 | Market Cap | 12.51B |
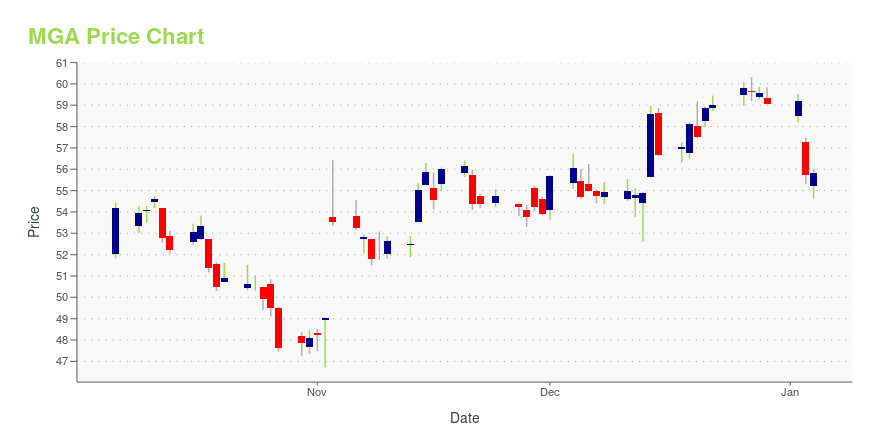
MGA Stock Price Chart Interactive Chart >
Magna International Inc. (MGA) Company Bio
Magna International Inc. is a Canadian parts manufacturer for automakers. It is one of the largest companies in Canada and was recognized on the 2020 Forbes Global 2000. The company is the largest automobile parts manufacturer in North America by sales of original equipment parts, it has ranked consistently in the Fortune Global 500 list for 20 years in a row since 2001. It produces automotive systems, assemblies, modules, and components, which are supplied to General Motors, Ford Motor Company and FCA, as well as BMW, Mercedes, Volkswagen, Toyota, Tesla, and Tata Motors, among others. (Source:Wikipedia)
Latest MGA News From Around the Web
Below are the latest news stories about MAGNA INTERNATIONAL INC that investors may wish to consider to help them evaluate MGA as an investment opportunity.
Is Magna International Inc. (TSE:MG) Trading At A 50% Discount?Key Insights The projected fair value for Magna International is CA$156 based on 2 Stage Free Cash Flow to Equity Magna... |
Best EV Stocks 2024: 3 Names to Add to Your Must-Buy ListExplore the top EV stocks for 2024, featuring the latest market trends and investment opportunities in the electric vehicle industry. |
Magna and 360ofme to Host Women of Inforum@CES Networking Reception to Connect Women in TechWomen are making important contributions to the burgeoning mobility industry, and the opportunities continue to grow. |
3 Undiscovered EV Stocks Revving Up for SuccessEV stocks are struggling as sales slip, but some little-known companies stand to gain from long-term industry prospects. |
Why This 1 Value Stock Could Be a Great Addition to Your PortfolioWondering how to pick strong, market-beating stocks for your investment portfolio? Look no further than the Zacks Style Scores. |
MGA Price Returns
| 1-mo | 4.71% |
| 3-mo | -9.61% |
| 6-mo | -19.63% |
| 1-year | -27.89% |
| 3-year | -39.65% |
| 5-year | 2.12% |
| YTD | -24.18% |
| 2023 | 9.69% |
| 2022 | -28.09% |
| 2021 | 15.49% |
| 2020 | 33.41% |
| 2019 | 24.30% |
MGA Dividends
| Ex-Dividend Date | Type | Payout Amount | Change | ||||||
|---|---|---|---|---|---|---|---|---|---|
| Loading, please wait... | |||||||||
Continue Researching MGA
Want to do more research on Magna International Inc's stock and its price? Try the links below:Magna International Inc (MGA) Stock Price | Nasdaq
Magna International Inc (MGA) Stock Quote, History and News - Yahoo Finance
Magna International Inc (MGA) Stock Price and Basic Information | MarketWatch
Loading social stream, please wait...