Magic Software Enterprises Ltd. - Ordinary Shares (MGIC): Price and Financial Metrics
MGIC Stock Summary
- MGIC's went public 29.51 years ago, making it older than 82.88% of listed US stocks we're tracking.
- With a year-over-year growth in debt of 1,048.96%, Magic Software Enterprises Ltd's debt growth rate surpasses 98.35% of about US stocks.
- As for revenue growth, note that MGIC's revenue has grown 84.99% over the past 12 months; that beats the revenue growth of 93.8% of US companies in our set.
- Stocks that are quantitatively similar to MGIC, based on their financial statements, market capitalization, and price volatility, are IKNX, UUU, MFGP, PFIE, and PERI.
- Visit MGIC's SEC page to see the company's official filings. To visit the company's web site, go to www.magicsoftware.com.
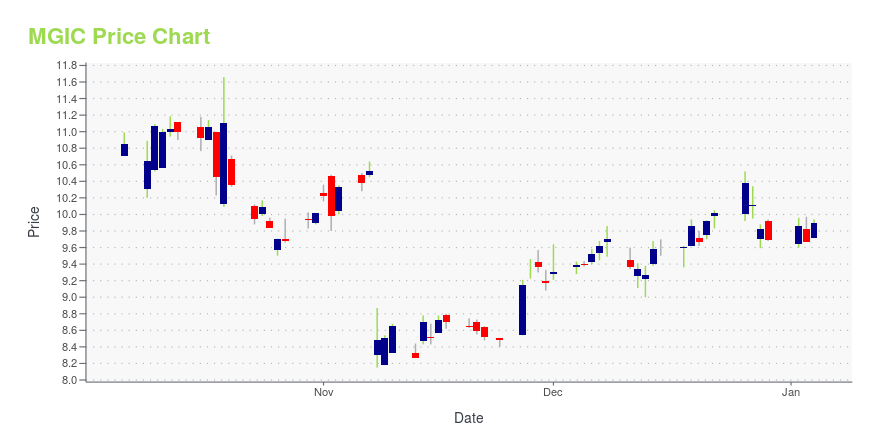
MGIC Stock Price Chart Interactive Chart >
MGIC Price/Volume Stats
Current price | $16.24 | 52-week high | $18.35 |
Prev. close | $16.45 | 52-week low | $6.31 |
Day low | $16.02 | Volume | 15,494 |
Day high | $16.35 | Avg. volume | 71,883 |
50-day MA | $16.20 | Dividend yield | 2.13% |
200-day MA | $13.71 | Market Cap | 794.77M |
Magic Software Enterprises Ltd. - Ordinary Shares (MGIC) Company Bio
Magic Software Enterprises Ltd. provides proprietary application development, business process integration, and vertical software solutions and related professional services. The company was founded in 1983 and is based in Or Yehuda, Israel.
MGIC Price Forecast Based on DCF Valuation
Current Price | DCF Fair Value Target: | Forecasted Gain: |
$16.24 | $19.9 | 21% |
Below please find a table outlining a discounted cash flow forecast for MGIC, in which we model out valuation assuming a variety of terminal growth rates. To summarize, we found that Magic Software Enterprises Ltd ranked in the 58th percentile in terms of potential gain offered. More precisely, our analysis suggests the stock is undervalued by approximately 21.67% on a DCF basis. The most interesting components of our discounted cash flow analysis for Magic Software Enterprises Ltd ended up being:
- The company's debt burden, as measured by earnings divided by interest payments, is 24 -- which is good for besting 77.96% of its peer stocks (US stocks in the Technology sector with positive cash flow).
- The business' balance sheet suggests that 4% of the company's capital is sourced from debt; this is greater than just 16.95% of the free cash flow producing stocks we're observing.
- MGIC's estimated cost of debt, based largely on its market capitalization and its interest coverage ratio, is 3%; for context, that number is higher than 43.97% of tickers in our DCF set.
Terminal Growth Rate in Free Cash Flow | Return Relative to Current Share Price |
0% | 19% |
1% | 20% |
2% | 21% |
3% | 22% |
4% | 23% |
5% | 25% |
For other companies in the Technology that have a similar discounted cashflow valuation profile (and ensuing price forecasts) as MGIC, try MTSI, CSGS, ELTK, SWI, and AMKR.
Latest MGIC News From Around the Web
Below are the latest news stories about Magic Software Enterprises Ltd that investors may wish to consider to help them evaluate MGIC as an investment opportunity.
Is Now The Time To Look At Buying Magic Software Enterprises Ltd. (NASDAQ:MGIC)?Magic Software Enterprises Ltd. ( NASDAQ:MGIC ), might not be a large cap stock, but it saw a significant share price... |
Magic Software (MGIC) Looks Good: Stock Adds 6.8% in SessionMagic Software (MGIC) saw a big move last session, as its shares jumped nearly 7% on the day, amid huge volumes. |
What Kind Of Shareholders Own Magic Software Enterprises Ltd. (NASDAQ:MGIC)?The big shareholder groups in Magic Software Enterprises Ltd. ( NASDAQ:MGIC ) have power over the company. Insiders... |
Magic Software (MGIC) Sees Hammer Chart Pattern: Time to Buy?Magic Software Enterprises (MGIC) has been struggling lately, but the selling pressure may be coming to an end soon. |
Should You Be Impressed By Magic Software Enterprises' (NASDAQ:MGIC) Returns on Capital?If we want to find a potential multi-bagger, often there are underlying trends that can provide clues. Firstly, we'd... |
MGIC Price Returns
1-mo | -3.73% |
3-mo | -2.05% |
6-mo | 4.98% |
1-year | 61.92% |
3-year | 114.65% |
5-year | 161.26% |
YTD | 3.77% |
2020 | 63.06% |
2019 | 32.73% |
2018 | -5.91% |
2017 | 27.76% |
2016 | 23.54% |
MGIC Dividends
Ex-Dividend Date | Type | Payout Amount | Change | ||||||
---|---|---|---|---|---|---|---|---|---|
Loading, please wait... |
Continue Researching MGIC
Want to do more research on Magic Software Enterprises Ltd's stock and its price? Try the links below:Magic Software Enterprises Ltd (MGIC) Stock Price | Nasdaq
Magic Software Enterprises Ltd (MGIC) Stock Quote, History and News - Yahoo Finance
Magic Software Enterprises Ltd (MGIC) Stock Price and Basic Information | MarketWatch
Get Free Updates
Join thousands of investors who get the latest news, insights and top rated picks from StockNews.com!
Loading social stream, please wait...