
Mesa Laboratories, Inc. (MLAB): Price and Financial Metrics
MLAB Price/Volume Stats
| Current price | $110.02 | 52-week high | $145.46 |
| Prev. close | $108.19 | 52-week low | $82.86 |
| Day low | $107.10 | Volume | 49,700 |
| Day high | $111.89 | Avg. volume | 46,034 |
| 50-day MA | $102.28 | Dividend yield | 0.56% |
| 200-day MA | $101.15 | Market Cap | 595.10M |
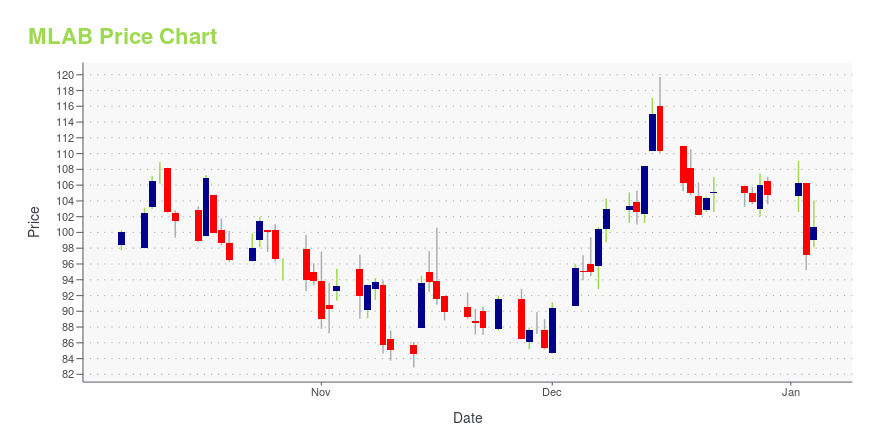
MLAB Stock Price Chart Interactive Chart >
Mesa Laboratories, Inc. (MLAB) Company Bio
Mesa Laboratories, Inc. designs, manufactures, and markets quality control instruments and disposable products. It operates through three segments: Instruments, Biological Indicators, and Continuous Monitoring. The company was founded in 1982 and is based in Lakewood, Colorado.
Latest MLAB News From Around the Web
Below are the latest news stories about MESA LABORATORIES INC that investors may wish to consider to help them evaluate MLAB as an investment opportunity.
Mesa Laboratories Inc (MLAB) Reports 9.5% Decrease in Q2 FY 2024 RevenuesCompany's Adjusted Operating Income Declines by 29.1% Quarter Over Quarter |
Mesa Labs Announces Second Quarter ResultsLAKEWOOD, Colo., Nov. 06, 2023 (GLOBE NEWSWIRE) -- Mesa Laboratories, Inc. (NASDAQ:MLAB), a global leader in the design and manufacturing of life science tools and critical quality control solutions, today announced results for its second fiscal quarter (“2Q24”) ended September 30, 2023. Second quarter FY 2024 compared to second quarter FY 2023: Revenues decreased 9.5% but increased 5.0% vs 1Q24Non-GAAP core organic revenues3 decreased 10.1% but increased 2.7% vs. 1Q24Operating income decreased |
Mesa Labs Acquires GKE-GmbH Complementary Sterilization Indicators and Healthcare Channels to Mesa’s SDC PlatformLakewood, Colo., Oct. 16, 2023 (GLOBE NEWSWIRE) -- Mesa Laboratories, Inc. (NASDAQ:MLAB) (“Mesa”, “we”, “us” or “our”), a global leader in the design and manufacturing of life science tools and critical quality control solutions, today announced the completed acquisition of GKE-GmbH’s sterilization indicators business and its accredited, independent testing lab SAL GmbH. Additionally, Mesa has entered into a definitive agreement to purchase GKE’s Chinese sales entity, Beijing GKE Science & Techn |
Shareholders in Mesa Laboratories (NASDAQ:MLAB) are in the red if they invested three years agoInvesting in stocks inevitably means buying into some companies that perform poorly. But long term Mesa Laboratories... |
MESA LABS DECLARES QUARTERLY DIVIDENDLAKEWOOD, Colo., Oct. 03, 2023 (GLOBE NEWSWIRE) -- Mesa Laboratories, Inc. (NASDAQ:MLAB) (we, us, our, “Mesa” or the “Company”) today announced that its Board of Directors has declared a regular quarterly dividend of $0.16 per share of common stock. The dividend will be payable on December 15, 2023, to shareholders of record at the close of business on November 30, 2023. About Mesa Laboratories, Inc. Mesa is a global leader in the design and manufacturing of life science tools and critical quali |
MLAB Price Returns
| 1-mo | 29.53% |
| 3-mo | 6.77% |
| 6-mo | 14.43% |
| 1-year | -13.57% |
| 3-year | -61.12% |
| 5-year | -52.57% |
| YTD | 5.32% |
| 2023 | -36.65% |
| 2022 | -49.18% |
| 2021 | 14.73% |
| 2020 | 15.22% |
| 2019 | 20.01% |
MLAB Dividends
| Ex-Dividend Date | Type | Payout Amount | Change | ||||||
|---|---|---|---|---|---|---|---|---|---|
| Loading, please wait... | |||||||||
Continue Researching MLAB
Here are a few links from around the web to help you further your research on Mesa Laboratories Inc's stock as an investment opportunity:Mesa Laboratories Inc (MLAB) Stock Price | Nasdaq
Mesa Laboratories Inc (MLAB) Stock Quote, History and News - Yahoo Finance
Mesa Laboratories Inc (MLAB) Stock Price and Basic Information | MarketWatch
Loading social stream, please wait...