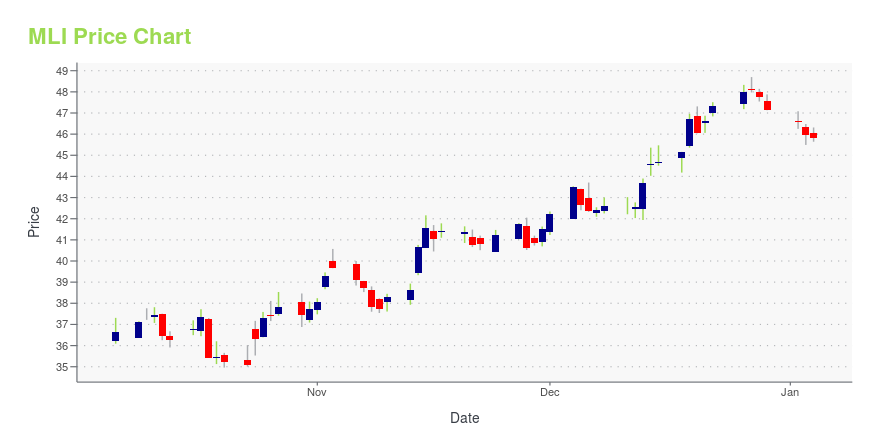
Mueller Industries, Inc. (MLI): Price and Financial Metrics
GET POWR RATINGS... FREE!
MLI POWR Grades
- Growth is the dimension where MLI ranks best; there it ranks ahead of 97.99% of US stocks.
- MLI's strongest trending metric is Growth; it's been moving up over the last 179 days.
- MLI's current lowest rank is in the Stability metric (where it is better than 62.1% of US stocks).
MLI Stock Summary
- Of note is the ratio of Mueller Industries Inc's sales and general administrative expense to its total operating expenses; 98.23% of US stocks have a lower such ratio.
- With a year-over-year growth in debt of -92.97%, Mueller Industries Inc's debt growth rate surpasses only 2.1% of about US stocks.
- Over the past twelve months, MLI has reported earnings growth of 199.95%, putting it ahead of 89.63% of US stocks in our set.
- Stocks with similar financial metrics, market capitalization, and price volatility to Mueller Industries Inc are APAM, TRNS, ODC, SMID, and GDOT.
- MLI's SEC filings can be seen here. And to visit Mueller Industries Inc's official web site, go to www.muellerindustries.com.
MLI Valuation Summary
- MLI's price/earnings ratio is 10; this is 62.48% lower than that of the median Industrials stock.
- Over the past 243 months, MLI's EV/EBIT ratio has gone up 0.1.
- Over the past 243 months, MLI's price/sales ratio has gone down 0.1.
Below are key valuation metrics over time for MLI.
Stock | Date | P/S | P/B | P/E | EV/EBIT |
---|---|---|---|---|---|
MLI | 2021-09-03 | 0.8 | 2.7 | 10.0 | 7.8 |
MLI | 2021-09-02 | 0.8 | 2.7 | 10.1 | 7.9 |
MLI | 2021-09-01 | 0.8 | 2.7 | 10.1 | 7.9 |
MLI | 2021-08-31 | 0.8 | 2.7 | 10.2 | 7.9 |
MLI | 2021-08-30 | 0.8 | 2.7 | 10.3 | 8.0 |
MLI | 2021-08-27 | 0.8 | 2.7 | 10.3 | 8.0 |
MLI Growth Metrics
- The year over year net income to common stockholders growth rate now stands at 44.64%.
- The 3 year price growth rate now stands at -10.78%.
- Its year over year price growth rate is now at 83.15%.

The table below shows MLI's growth in key financial areas (numbers in millions of US dollars).
Date | Revenue | Operating Cash Flow | Net Income to Common Stock |
---|---|---|---|
2021-12-31 | 3,769.345 | 311.701 | 468.52 |
2021-09-30 | 3,488.839 | 229.676 | 379.339 |
2021-06-30 | 3,125.696 | 111.571 | 251.061 |
2021-03-31 | 2,613.272 | 194.441 | 170.185 |
2020-12-31 | 2,398.043 | 245.073 | 139.493 |
2020-09-30 | 2,266.031 | 265.495 | 131.243 |
MLI's Quality Factors
The “Quality” component of the POWR Ratings focuses on 31 different factors of a companies fundamentals and operational strength. Here are some key insights as we drill into the specifics of these quality attributes.- MLI has a Quality Grade of B, ranking ahead of 85.84% of graded US stocks.
- MLI's asset turnover comes in at 2.069 -- ranking 1st of 41 Steel Works Etc stocks.
- WIRE, TWI, and UAMY are the stocks whose asset turnover ratios are most correlated with MLI.
The table below shows MLI's key quality metrics over time.
Period | Asset Turnover | Gross Margin | ROIC |
---|---|---|---|
2021-09-25 | 2.069 | 0.207 | 0.412 |
2021-06-26 | 1.943 | 0.193 | 0.278 |
2021-03-27 | 1.751 | 0.187 | 0.211 |
2020-12-26 | 1.678 | 0.180 | 0.178 |
2020-09-26 | 1.630 | 0.178 | 0.167 |
2020-06-27 | 1.628 | 0.170 | 0.146 |
MLI Price Target
For more insight on analysts targets of MLI, see our MLI price target page. And for a list of of all stocks sorted by upside potential based on analyst target price, see our Top Price Target page.
Average Price Target | $100.00 | Average Broker Recommendation | 1.5 (Moderate Buy) |
MLI Stock Price Chart Interactive Chart >
MLI Price/Volume Stats
Current price | $53.28 | 52-week high | $63.07 |
Prev. close | $53.29 | 52-week low | $39.00 |
Day low | $52.27 | Volume | 214,300 |
Day high | $54.05 | Avg. volume | 326,184 |
50-day MA | $54.32 | Dividend yield | 1.88% |
200-day MA | $54.19 | Market Cap | 3.03B |
Mueller Industries, Inc. (MLI) Company Bio
Mueller Industries manufactures and sells plumbing, heating, ventilation, and air-conditioning products, as well as refrigeration and industrial products in the United States, Canada, Mexico, Great Britain, and China. The company was founded in 1900 and is based in Memphis, Tennessee.
Latest MLI News From Around the Web
Below are the latest news stories about Mueller Industries Inc that investors may wish to consider to help them evaluate MLI as an investment opportunity.
Mueller Industries (NYSE:MLI) Is Paying Out A Larger Dividend Than Last YearThe board of Mueller Industries, Inc. ( NYSE:MLI ) has announced that it will be increasing its dividend by 92% on the... |
Earnings roundup: MAA caps solid fiscal year; Mueller increases quarterly dividend by 92%FedEx, International Paper, and AutoZone are the only local public companies on the Fortune 500 list, but the Memphis metro has 10 public companies, most of which earn more than $1 billion annually and employ hundreds locally — plus thousands companywide. Here's what two of those companies — MAA and Mueller Industries Inc. — have been up to recently. In mid-December, Germantown-based MAA announced promotions to members of its leadership team, with chairman and CEO Eric Bolton citing the company’s strong performance trends and external growth. |
Dow Jones, Nasdaq Extend Weekly Losses On Threat Of Ukraine Invasion; Three IBD 50 Stocks Are Setting UpThe Dow Jones Industrial Average, Nasdaq and S&P 500 continued to pull lower on Friday despite a bullish reversal on Wednesday. Only a few companies within the IBD 50, meanwhile, are setting up promising new bases. At around 1:30 p.m. ET, the Dow Jones industrials were down 0.9%, after getting turned away at resistance at the 200-day moving average earlier this week. |
Mueller Industries, Inc. Announces 92 Percent Increase in Quarterly DividendCOLLIERVILLE, Tenn., February 18, 2022--Mueller Industries, Inc. (NYSE: MLI) announced today that its Board of Directors has declared a regular quarterly cash dividend. |
This Copper Manufacturer Shines, Stages A Comeback On White-Hot Earnings Growth; Nears Buy PointMueller Industries has seen significant earnings growth, with EPS of $8.25 in 2021, up 234% from $2.47 in 2020. |
MLI Price Returns
1-mo | -4.82% |
3-mo | -1.36% |
6-mo | -9.52% |
1-year | 27.46% |
3-year | 90.24% |
5-year | 84.12% |
YTD | -9.44% |
2021 | 70.95% |
2020 | 12.30% |
2019 | 37.79% |
2018 | -33.10% |
2017 | -10.26% |
MLI Dividends
Ex-Dividend Date | Type | Payout Amount | Change | ||||||
---|---|---|---|---|---|---|---|---|---|
Loading, please wait... |
Continue Researching MLI
Here are a few links from around the web to help you further your research on Mueller Industries Inc's stock as an investment opportunity:Mueller Industries Inc (MLI) Stock Price | Nasdaq
Mueller Industries Inc (MLI) Stock Quote, History and News - Yahoo Finance
Mueller Industries Inc (MLI) Stock Price and Basic Information | MarketWatch
Loading social stream, please wait...