Moog Inc. (MOG.A): Price and Financial Metrics
MOG.A Price/Volume Stats
Current price | $112.07 | 52-week high | $119.67 |
Prev. close | $112.96 | 52-week low | $70.27 |
Day low | $111.53 | Volume | 108,700 |
Day high | $113.65 | Avg. volume | 131,981 |
50-day MA | $112.60 | Dividend yield | 0.95% |
200-day MA | $101.72 | Market Cap | 3.57B |
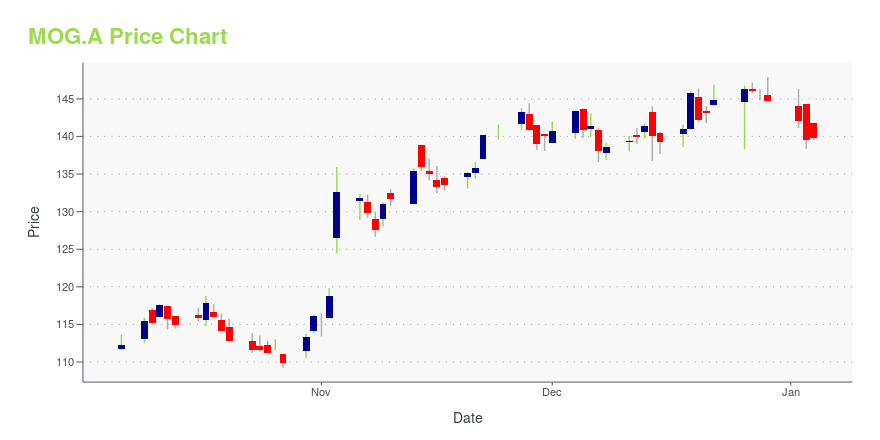
MOG.A Stock Price Chart Interactive Chart >
MOG.A POWR Grades
- Growth is the dimension where MOG.A ranks best; there it ranks ahead of 84.63% of US stocks.
- The strongest trend for MOG.A is in Stability, which has been heading down over the past 177 days.
- MOG.A's current lowest rank is in the Quality metric (where it is better than 58.3% of US stocks).
MOG.A Stock Summary
- With a one year PEG ratio of 168.93, MOOG INC is expected to have a higher PEG ratio (a measure of how expensive a stock is relative to its expected earnings growth) than 84.09% of US stocks.
- MOOG INC's stock had its IPO on February 21, 1992, making it an older stock than 83.23% of US equities in our set.
- Price to trailing twelve month operating cash flow for MOG.A is currently 76.07, higher than 96.39% of US stocks with positive operating cash flow.
- Stocks with similar financial metrics, market capitalization, and price volatility to MOOG INC are MMSI, FEIM, VNT, GNRC, and BC.
- MOG.A's SEC filings can be seen here. And to visit MOOG INC's official web site, go to www.moog.com.
MOG.A Valuation Summary
- In comparison to the median Industrials stock, MOG.A's price/sales ratio is 8.33% lower, now standing at 1.1.
- MOG.A's price/earnings ratio has moved up 7.9 over the prior 243 months.
Below are key valuation metrics over time for MOG.A.
Stock | Date | P/S | P/B | P/E | EV/EBIT |
---|---|---|---|---|---|
MOG.A | 2023-09-19 | 1.1 | 2.2 | 22.3 | 16.8 |
MOG.A | 2023-09-18 | 1.1 | 2.2 | 22.5 | 16.9 |
MOG.A | 2023-09-15 | 1.1 | 2.2 | 22.1 | 16.6 |
MOG.A | 2023-09-14 | 1.1 | 2.2 | 22.3 | 16.8 |
MOG.A | 2023-09-13 | 1.1 | 2.2 | 22.2 | 16.7 |
MOG.A | 2023-09-12 | 1.1 | 2.2 | 22.3 | 16.8 |
MOG.A Growth Metrics
- Its 3 year cash and equivalents growth rate is now at 8.98%.
- Its 4 year revenue growth rate is now at 23.3%.
- The year over year revenue growth rate now stands at 5.09%.

The table below shows MOG.A's growth in key financial areas (numbers in millions of US dollars).
Date | Revenue | Operating Cash Flow | Net Income to Common Stock |
---|---|---|---|
2022-12-31 | 3,071.8 | 97.7 | 154.928 |
2022-09-30 | 3,035.783 | 246.802 | 155.177 |
2022-06-30 | 2,992.069 | 246.91 | 160.329 |
2022-03-31 | 2,926.51 | 336.056 | 146.042 |
2021-12-31 | 2,892.125 | 356.316 | 165.643 |
2021-09-30 | 2,851.993 | 293.226 | 157.22 |
MOG.A's Quality Factors
The “Quality” component of the POWR Ratings focuses on 31 different factors of a companies fundamentals and operational strength. Here are some key insights as we drill into the specifics of these quality attributes.- MOG.A has a Quality Grade of B, ranking ahead of 75.09% of graded US stocks.
- MOG.A's asset turnover comes in at 0.847 -- ranking 33rd of 104 Machinery stocks.
- EKSO, CECE, and XONE are the stocks whose asset turnover ratios are most correlated with MOG.A.
The table below shows MOG.A's key quality metrics over time.
Period | Asset Turnover | Gross Margin | ROIC |
---|---|---|---|
2021-07-03 | 0.847 | 0.266 | 0.039 |
2021-04-03 | 0.841 | 0.256 | 0.010 |
2021-01-02 | 0.851 | 0.257 | 0.010 |
2020-10-03 | 0.873 | 0.258 | 0.017 |
2020-06-27 | 0.899 | 0.264 | 0.081 |
2020-03-28 | 0.937 | 0.277 | 0.118 |
MOG.A Price Target
For more insight on analysts targets of MOG.A, see our MOG.A price target page. And for a list of of all stocks sorted by upside potential based on analyst target price, see our Top Price Target page.
Average Price Target | $105.00 | Average Broker Recommendation | 1.5 (Moderate Buy) |
Moog Inc. (MOG.A) Company Bio
Moog Inc. designs, manufactures, and integrates precision motion and fluid controls and systems for original equipment manufacturers and end users in the aerospace, defense, and industrial markets worldwide. The company was founded in 1951 and is based in East Aurora, New York.
Latest MOG.A News From Around the Web
Below are the latest news stories about MOOG INC that investors may wish to consider to help them evaluate MOG.A as an investment opportunity.
Wall Street Analysts Are Bullish on Top Technology PicksThere's a lot to be optimistic about in the Technology sector as 2 analysts just weighed in on Apple (AAPL – Research Report) and Moog (MOG.A – Research Report) with bullish sentiments. Apple (AAPL) In a report released today, Samik Chatterjee from J.P. Morgan maintained a Buy rating on Apple, with a price target of $200.00. The company's shares closed last Friday at $138.38. According to TipRanks. |
MOG.A Price Returns
1-mo | -6.20% |
3-mo | 4.28% |
6-mo | 14.83% |
1-year | 56.04% |
3-year | 73.96% |
5-year | 38.78% |
YTD | 28.72% |
2022 | 9.79% |
2021 | 3.39% |
2020 | -6.14% |
2019 | 11.41% |
2018 | -9.94% |
MOG.A Dividends
Ex-Dividend Date | Type | Payout Amount | Change | ||||||
---|---|---|---|---|---|---|---|---|---|
Loading, please wait... |
Continue Researching MOG.A
Want to see what other sources are saying about Moog Inc's financials and stock price? Try the links below:Moog Inc (MOG.A) Stock Price | Nasdaq
Moog Inc (MOG.A) Stock Quote, History and News - Yahoo Finance
Moog Inc (MOG.A) Stock Price and Basic Information | MarketWatch
Loading social stream, please wait...