
Monroe Capital Corporation (MRCC): Price and Financial Metrics
MRCC Price/Volume Stats
| Current price | $7.69 | 52-week high | $8.85 |
| Prev. close | $7.55 | 52-week low | $6.69 |
| Day low | $7.54 | Volume | 28,900 |
| Day high | $7.69 | Avg. volume | 65,387 |
| 50-day MA | $7.54 | Dividend yield | 12.81% |
| 200-day MA | $7.27 | Market Cap | 166.64M |
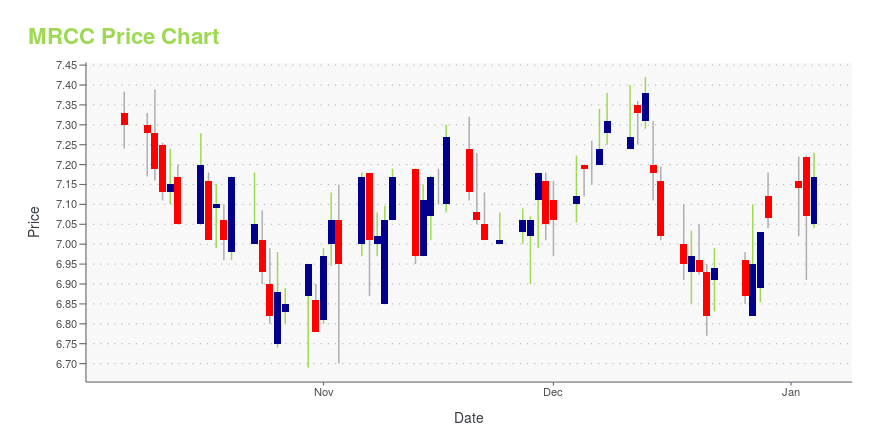
MRCC Stock Price Chart Interactive Chart >
Monroe Capital Corporation (MRCC) Company Bio
Monroe Capital LLC is a private equity firm specializing in bridge loans, exit financing, capital restructuring, buyouts, leveraged recapitalizations, turnaround, growth capital, acquisition, expansion, refinancings, balance sheet restructurings, portfolio acquisitions, unitranche financings, senior and junior debt, mezzanine debt, second lien or last-out loans, senior loans, equity co-investments for both ESOP and non-ESOP transactions and acquisitions of distressed debt. The company was founded in 2004 and is based in Chicago, Illinois.
Latest MRCC News From Around the Web
Below are the latest news stories about MONROE CAPITAL CORP that investors may wish to consider to help them evaluate MRCC as an investment opportunity.
Monroe Capital Corporation Announces Fourth Quarter Distribution of $0.25 Per ShareCHICAGO, Dec. 01, 2023 (GLOBE NEWSWIRE) -- Monroe Capital Corporation (the “Company”) (NASDAQ: MRCC) announced today that its Board of Directors has declared a distribution of $0.25 per share for the fourth quarter of 2023, payable on December 29, 2023 to stockholders of record as of December 15, 2023. In October 2012, the Company adopted a dividend reinvestment plan that provides for reinvestment of distributions on behalf of its stockholders, unless a stockholder elects to receive cash prior t |
Monroe Capital Corporation (NASDAQ:MRCC) Q3 2023 Earnings Call TranscriptMonroe Capital Corporation (NASDAQ:MRCC) Q3 2023 Earnings Call Transcript November 9, 2023 Operator: Welcome to Monroe Capital Corporation’s Third Quarter 2023 Earnings Conference Call. Before we begin, I would like to take the moment to remind our listeners that remarks made during this call today may contain certain forward statements — forward-looking statements, including statements […] |
Q3 2023 Monroe Capital Corp Earnings CallQ3 2023 Monroe Capital Corp Earnings Call |
Monroe Capital Corporation BDC Announces Third Quarter 2023 ResultsCHICAGO, Nov. 08, 2023 (GLOBE NEWSWIRE) -- Monroe Capital Corporation (Nasdaq: MRCC) (“Monroe”) today announced its financial results for the third quarter ended September 30, 2023. Except where the context suggests otherwise, the terms “Monroe,” “we,” “us,” “our,” and “Company” refer to Monroe Capital Corporation. Third Quarter 2023 Financial Highlights Net Investment Income of $5.4 million, or $0.25 per shareAdjusted Net Investment Income (a non-GAAP measure described below) of $5.5 million, o |
3 Business Development Companies Yielding Over 7%Business development companies (BDCs) often offer impressive dividend yields. |
MRCC Price Returns
| 1-mo | 1.85% |
| 3-mo | 8.50% |
| 6-mo | 12.47% |
| 1-year | 0.47% |
| 3-year | 1.44% |
| 5-year | 22.40% |
| YTD | 16.37% |
| 2023 | -5.68% |
| 2022 | -15.37% |
| 2021 | 53.23% |
| 2020 | -15.17% |
| 2019 | 27.80% |
MRCC Dividends
| Ex-Dividend Date | Type | Payout Amount | Change | ||||||
|---|---|---|---|---|---|---|---|---|---|
| Loading, please wait... | |||||||||
Continue Researching MRCC
Want to do more research on MONROE CAPITAL Corp's stock and its price? Try the links below:MONROE CAPITAL Corp (MRCC) Stock Price | Nasdaq
MONROE CAPITAL Corp (MRCC) Stock Quote, History and News - Yahoo Finance
MONROE CAPITAL Corp (MRCC) Stock Price and Basic Information | MarketWatch
Loading social stream, please wait...