
MSA Safety Incorporated (MSA): Price and Financial Metrics
MSA Price/Volume Stats
| Current price | $189.58 | 52-week high | $200.60 |
| Prev. close | $191.78 | 52-week low | $147.35 |
| Day low | $188.45 | Volume | 175,530 |
| Day high | $193.22 | Avg. volume | 153,422 |
| 50-day MA | $185.80 | Dividend yield | 1.05% |
| 200-day MA | $176.80 | Market Cap | 7.47B |
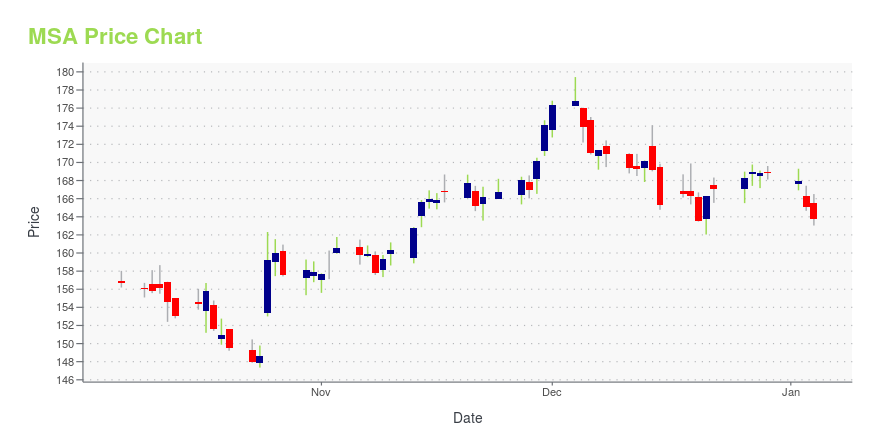
MSA Stock Price Chart Interactive Chart >
MSA Safety Incorporated (MSA) Company Bio
MSA Safety Inc. is a global leader in the development, manufacture and supply of safety products that protect people and facility infrastructures. Many MSA products integrate a combination of electronics, mechanical systems and advanced materials to protect users against hazardous or life-threatening situations. The company was founded in 1914 and is based in Cranberry Township, Pennsylvania.
Latest MSA News From Around the Web
Below are the latest news stories about MSA SAFETY INC that investors may wish to consider to help them evaluate MSA as an investment opportunity.
MSA Safety Named One of America's Best-Managed Companies of 2023 by The Wall Street JournalMSA Safety, Inc. (NYSE: MSA), the global leader in the development of safety solutions that help protect people and facility infrastructures, today announced it has been named one of the Best-Managed Companies of 2023 by The Wall Street Journal (WSJ). |
Estimating The Intrinsic Value Of MSA Safety Incorporated (NYSE:MSA)Key Insights Using the 2 Stage Free Cash Flow to Equity, MSA Safety fair value estimate is US$163 MSA Safety's US$170... |
MSA Safety awarded $35 Million Breathing Apparatus Contract with U.S. Air ForceMSA Safety, Inc. (NYSE: MSA) today announced it was awarded a $35 million contract with the U.S. Air Force to provide its air base fire brigades with new respiratory protective equipment. The contract covers the supply of MSA's G1 Self-Contained Breathing Apparatus (SCBA) model along with related facepieces, chemical warfare component (CWC) masks, and supplied-air respirator (SAR) kits, which enable the SCBA to be used as a longer-duration airline device. The units will replace older model MSA a |
New Strong Buy Stocks for November 7thGWRE, REZI, NECB, MSA and FCNCA have been added to the Zacks Rank #1 (Strong Buy) List on November 7, 2023. |
MSA Safety to Present at Baird's 2023 Global Industrial ConferenceMSA Safety Incorporated (NYSE: MSA), the global leader in the development, manufacture and supply of safety products and software that protect people and facility infrastructures, today announced that Nish Vartanian, Chairman and Chief Executive Officer, and Lee McChesney, Senior Vice President and Chief Financial Officer, will speak at the Baird 2023 Global Industrial Conference on Wednesday, November 8, 2023. The discussion will begin at 11:15 a.m. Eastern Time and last for approximately 30 mi |
MSA Price Returns
| 1-mo | 0.99% |
| 3-mo | 0.70% |
| 6-mo | 14.77% |
| 1-year | 15.51% |
| 3-year | 21.06% |
| 5-year | 91.03% |
| YTD | 12.90% |
| 2023 | 18.52% |
| 2022 | -3.15% |
| 2021 | 2.14% |
| 2020 | 19.79% |
| 2019 | 36.10% |
MSA Dividends
| Ex-Dividend Date | Type | Payout Amount | Change | ||||||
|---|---|---|---|---|---|---|---|---|---|
| Loading, please wait... | |||||||||
Continue Researching MSA
Want to see what other sources are saying about MSA Safety Inc's financials and stock price? Try the links below:MSA Safety Inc (MSA) Stock Price | Nasdaq
MSA Safety Inc (MSA) Stock Quote, History and News - Yahoo Finance
MSA Safety Inc (MSA) Stock Price and Basic Information | MarketWatch
Loading social stream, please wait...