Molecular Templates, Inc. (MTEM): Price and Financial Metrics
GET POWR RATINGS... FREE!
MTEM Stock Summary
- MTEM has a market capitalization of $18,314,285 -- more than approximately just 7.98% of US stocks.
- The capital turnover (annual revenue relative to shareholder's equity) for MTEM is 8.46 -- better than 95.69% of US stocks.
- Of note is the ratio of MOLECULAR TEMPLATES INC's sales and general administrative expense to its total operating expenses; merely 10.75% of US stocks have a lower such ratio.
- Stocks that are quantitatively similar to MTEM, based on their financial statements, market capitalization, and price volatility, are CTMX, SELB, SIMO, CRUS, and IMTX.
- MTEM's SEC filings can be seen here. And to visit MOLECULAR TEMPLATES INC's official web site, go to www.mtem.com.
MTEM Valuation Summary
- In comparison to the median Healthcare stock, MTEM's EV/EBIT ratio is 109.16% lower, now standing at -0.6.
- MTEM's price/sales ratio has moved NA NA over the prior 220 months.
Below are key valuation metrics over time for MTEM.
Stock | Date | P/S | P/B | P/E | EV/EBIT |
---|---|---|---|---|---|
MTEM | 2023-03-17 | 0.5 | 4.4 | -0.2 | -0.6 |
MTEM | 2023-03-16 | 0.5 | 4.6 | -0.2 | -0.6 |
MTEM | 2023-03-15 | 0.5 | 4.5 | -0.2 | -0.6 |
MTEM | 2023-03-14 | 0.6 | 4.8 | -0.2 | -0.6 |
MTEM | 2023-03-13 | 0.6 | 4.8 | -0.2 | -0.6 |
MTEM | 2023-03-10 | 0.8 | 6.9 | -0.4 | -0.7 |
MTEM Growth Metrics
- Its 2 year cash and equivalents growth rate is now at -43.18%.
- The 3 year net cashflow from operations growth rate now stands at -1453.07%.
- The 4 year cash and equivalents growth rate now stands at 201.14%.

The table below shows MTEM's growth in key financial areas (numbers in millions of US dollars).
Date | Revenue | Operating Cash Flow | Net Income to Common Stock |
---|---|---|---|
2022-09-30 | 35.107 | -93.053 | -80.912 |
2022-06-30 | 33.246 | -93.436 | -86.661 |
2022-03-31 | 43.963 | -100.297 | -77.842 |
2021-12-31 | 38.697 | -30.387 | -83.009 |
2021-09-30 | 24.23 | -29.432 | -101.211 |
2021-06-30 | 26.149 | -24.44 | -94.049 |
MTEM's Quality Factors
The “Quality” component of the POWR Ratings focuses on 31 different factors of a companies fundamentals and operational strength. Here are some key insights as we drill into the specifics of these quality attributes.- MTEM has a Quality Grade of C, ranking ahead of 37.75% of graded US stocks.
- MTEM's asset turnover comes in at 0.13 -- ranking 237th of 681 Pharmaceutical Products stocks.
- AGEN, ARDX, and LGND are the stocks whose asset turnover ratios are most correlated with MTEM.
The table below shows MTEM's key quality metrics over time.
Period | Asset Turnover | Gross Margin | ROIC |
---|---|---|---|
2021-06-30 | 0.130 | 1 | -0.688 |
2021-03-31 | 0.102 | 1 | -1.004 |
2020-12-31 | 0.123 | 1 | -0.976 |
2020-09-30 | 0.133 | 1 | -0.940 |
2020-06-30 | 0.146 | 1 | -1.283 |
2020-03-31 | 0.139 | 1 | -1.005 |
MTEM Price Target
For more insight on analysts targets of MTEM, see our MTEM price target page. And for a list of of all stocks sorted by upside potential based on analyst target price, see our Top Price Target page.
Average Price Target | $13.43 | Average Broker Recommendation | 1.33 (Strong Buy) |
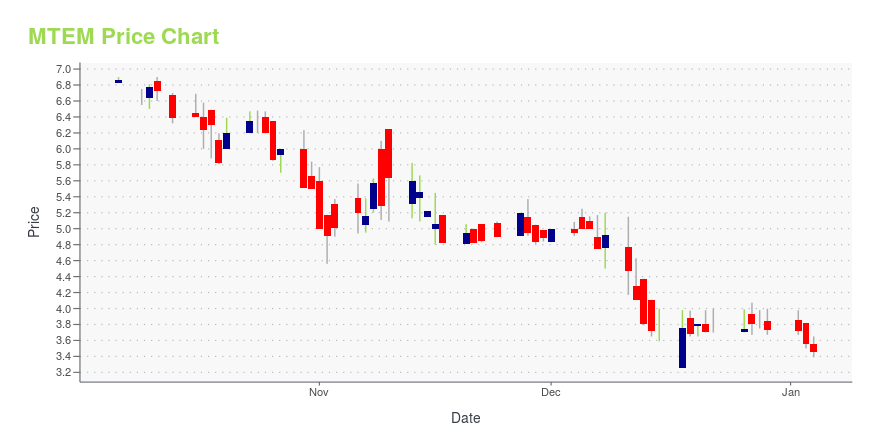
MTEM Stock Price Chart Interactive Chart >
MTEM Price/Volume Stats
Current price | $0.35 | 52-week high | $3.64 |
Prev. close | $0.34 | 52-week low | $0.31 |
Day low | $0.33 | Volume | 334,500 |
Day high | $0.38 | Avg. volume | 857,720 |
50-day MA | $0.47 | Dividend yield | N/A |
200-day MA | $0.66 | Market Cap | 19.72M |
Molecular Templates, Inc. (MTEM) Company Bio
Molecular Templates, Inc., a clinical stage biopharmaceutical company, focuses on the discovery, development, and commercialization of immunotoxins called engineered toxin bodies for the treatment of cancer and other serious diseases. It develops MT-3724, a lead drug candidate that is in a Phase 1 clinical trial in heavily pre-treated non-Hodgkin's lymphoma patients; MT-4019, a preclinical drug candidate targeting CD38; and evofosfamide, an investigational hypoxia-activated prodrug of a bis-alkylating agent that is preferentially activated under severe hypoxic tumor conditions, a feature of many solid tumors. The company is based in Austin, Texas.
Latest MTEM News From Around the Web
Below are the latest news stories about MOLECULAR TEMPLATES INC that investors may wish to consider to help them evaluate MTEM as an investment opportunity.
Today’s Biggest Pre-Market Stock Movers: 10 Top Gainers and Losers on FridayWe're starting the final day of the week with a breakdown of the biggest pre-market stock movers worth watching on Friday! |
Why Is Allbirds (BIRD) Stock Down 25% Today?Allbirds (BIRD) stock is falling hard on Friday following the release of its earnings report for the fourth quarter of 2022. |
Why Is Barnes & Noble Education (BNED) Stock Up 20% Today?Barnes & Noble Education (BNED) stock is climbing higher on Friday following the release of its earnings report for fiscal Q3 2023. |
Why Is Molecular Templates (MTEM) Stock Up 36% Today?Molecular Templates (MTEM) stock is rocketing higher on Friday after the company got approval from the FDA for a clinical trial. |
Why Is SVB Financial (SIVB) Stock Down 44% Today?SVB Financial (SIVB) stock continues to fall on Friday after the company revealed plans for a public offering to raise funds. |
MTEM Price Returns
1-mo | N/A |
3-mo | -0.51% |
6-mo | -50.47% |
1-year | -86.38% |
3-year | -97.31% |
5-year | -96.18% |
YTD | 6.71% |
2022 | -91.63% |
2021 | -58.25% |
2020 | -32.86% |
2019 | 246.16% |
2018 | -59.68% |
Continue Researching MTEM
Want to see what other sources are saying about Molecular Templates Inc's financials and stock price? Try the links below:Molecular Templates Inc (MTEM) Stock Price | Nasdaq
Molecular Templates Inc (MTEM) Stock Quote, History and News - Yahoo Finance
Molecular Templates Inc (MTEM) Stock Price and Basic Information | MarketWatch
Loading social stream, please wait...