Mannatech, Incorporated (MTEX): Price and Financial Metrics
GET POWR RATINGS... FREE!
MTEX POWR Grades
- Quality is the dimension where MTEX ranks best; there it ranks ahead of 99.93% of US stocks.
- MTEX's strongest trending metric is Sentiment; it's been moving up over the last 41 days.
- MTEX ranks lowest in Momentum; there it ranks in the 37th percentile.
MTEX Stock Summary
- The capital turnover (annual revenue relative to shareholder's equity) for MTEX is 6.54 -- better than 94.87% of US stocks.
- The ratio of debt to operating expenses for Mannatech Inc is higher than it is for about merely 5.03% of US stocks.
- With a year-over-year growth in debt of -55.28%, Mannatech Inc's debt growth rate surpasses only 6.31% of about US stocks.
- Stocks that are quantitatively similar to MTEX, based on their financial statements, market capitalization, and price volatility, are CBRL, NATR, CRMT, MOXC, and ULH.
- MTEX's SEC filings can be seen here. And to visit Mannatech Inc's official web site, go to www.mannatech.com.
MTEX Valuation Summary
- MTEX's price/sales ratio is 0.4; this is 71.43% lower than that of the median Consumer Defensive stock.
- MTEX's price/earnings ratio has moved up 12.3 over the prior 243 months.
- MTEX's EV/EBIT ratio has moved up 7.2 over the prior 243 months.
Below are key valuation metrics over time for MTEX.
Stock | Date | P/S | P/B | P/E | EV/EBIT |
---|---|---|---|---|---|
MTEX | 2021-09-03 | 0.4 | 2.7 | 9.5 | 5.1 |
MTEX | 2021-09-02 | 0.4 | 2.7 | 9.5 | 5.1 |
MTEX | 2021-09-01 | 0.4 | 2.6 | 9.4 | 5.0 |
MTEX | 2021-08-31 | 0.4 | 2.7 | 9.5 | 5.1 |
MTEX | 2021-08-30 | 0.4 | 2.7 | 9.6 | 5.2 |
MTEX | 2021-08-27 | 0.4 | 2.6 | 9.3 | 4.9 |
MTEX Growth Metrics
- Its 4 year net cashflow from operations growth rate is now at 32.02%.
- Its 2 year net cashflow from operations growth rate is now at -34.75%.
- Its 2 year net income to common stockholders growth rate is now at 770.27%.

The table below shows MTEX's growth in key financial areas (numbers in millions of US dollars).
Date | Revenue | Operating Cash Flow | Net Income to Common Stock |
---|---|---|---|
2021-12-31 | 159.762 | 10.774 | 9.842 |
2021-09-30 | 159.458 | 13.595 | 7.98 |
2021-06-30 | 157.978 | 11.875 | 6.666 |
2021-03-31 | 153.121 | 6.589 | 5.667 |
2020-12-31 | 151.407 | 6.03 | 6.261 |
2020-09-30 | 151.606 | 2.046 | 7.638 |
MTEX's Quality Factors
The “Quality” component of the POWR Ratings focuses on 31 different factors of a companies fundamentals and operational strength. Here are some key insights as we drill into the specifics of these quality attributes.- MTEX has a Quality Grade of A, ranking ahead of 99.91% of graded US stocks.
- MTEX's asset turnover comes in at 2.459 -- ranking 3rd of 681 Pharmaceutical Products stocks.
- EPZM, RIOT, and AMPH are the stocks whose asset turnover ratios are most correlated with MTEX.
The table below shows MTEX's key quality metrics over time.
Period | Asset Turnover | Gross Margin | ROIC |
---|---|---|---|
2021-06-30 | 2.459 | 0.765 | 0.799 |
2021-03-31 | 2.381 | 0.767 | 0.566 |
2020-12-31 | 2.354 | 0.765 | 0.485 |
2020-09-30 | 2.380 | 0.780 | 0.548 |
2020-06-30 | 2.371 | 0.793 | 0.483 |
2020-03-31 | 2.390 | 0.801 | 0.726 |
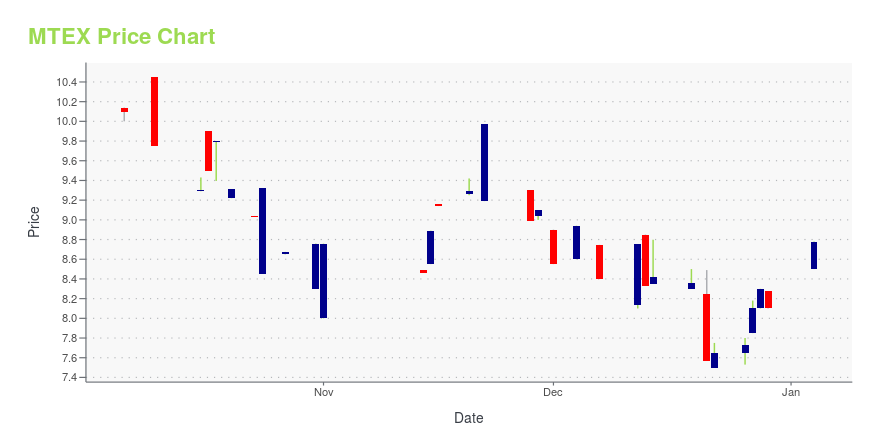
MTEX Stock Price Chart Interactive Chart >
MTEX Price/Volume Stats
Current price | $25.05 | 52-week high | $49.08 |
Prev. close | $24.39 | 52-week low | $20.33 |
Day low | $24.07 | Volume | 18,600 |
Day high | $25.87 | Avg. volume | 6,071 |
50-day MA | $32.30 | Dividend yield | 3.28% |
200-day MA | $34.81 | Market Cap | 48.85M |
Mannatech, Incorporated (MTEX) Company Bio
Mannatech, Incorporated provides wellness solutions. It develops, markets, and sells nutritional supplements; topical and skin care, and anti-aging products; and weight-management products. The company primarily sells its products directly, as well as through network marketing channels and a Website. It operates in the Americas, Europe, the Middle East, Africa, and the Asia Pacific. Mannatech, Incorporated was founded in 1993 and is headquartered in Flower Mound, Texas.
Latest MTEX News From Around the Web
Below are the latest news stories about Mannatech Inc that investors may wish to consider to help them evaluate MTEX as an investment opportunity.
Mannatech (NASDAQ:MTEX) shareholders have earned a 119% return over the last yearThe most you can lose on any stock (assuming you don't use leverage) is 100% of your money. On the other hand, if you... |
Comparing Mannatech (MTEX) & The CompetitionMannatech (NASDAQ: MTEX) is one of 43 public companies in the Medicinals & botanicals industry, but how does it weigh in compared to its rivals? We will compare Mannatech to similar businesses based on the strength of its earnings, institutional ownership, analyst recommendations, profitability, valuation, dividends and risk. Profitability This table compares Mannatech and its [] |
Mannatech (MTEX) and Its Rivals Head-To-Head ComparisonMannatech (NASDAQ: MTEX) is one of 43 public companies in the Medicinals & botanicals industry, but how does it weigh in compared to its peers? We will compare Mannatech to similar companies based on the strength of its earnings, institutional ownership, risk, valuation, dividends, analyst recommendations and profitability. Dividends Mannatech pays an annual dividend of [] |
Mannatech (MTEX) & Its Peers Critical SurveyMannatech (NASDAQ: MTEX) is one of 43 public companies in the Medicinals & botanicals industry, but how does it weigh in compared to its competitors? We will compare Mannatech to similar businesses based on the strength of its valuation, institutional ownership, profitability, dividends, risk, analyst recommendations and earnings. Dividends Mannatech pays an annual dividend of [] |
Comparing Mannatech (MTEX) and The CompetitionMannatech (NASDAQ: MTEX) is one of 43 publicly-traded companies in the Medicinals & botanicals industry, but how does it weigh in compared to its peers? We will compare Mannatech to similar businesses based on the strength of its risk, dividends, profitability, valuation, earnings, institutional ownership and analyst recommendations. Analyst Ratings This is a breakdown of [] |
MTEX Price Returns
1-mo | -20.43% |
3-mo | -29.64% |
6-mo | -31.27% |
1-year | 30.20% |
3-year | 68.10% |
5-year | 127.11% |
YTD | -34.23% |
2021 | 120.10% |
2020 | 26.22% |
2019 | -11.79% |
2018 | 36.74% |
2017 | -23.60% |
MTEX Dividends
Ex-Dividend Date | Type | Payout Amount | Change | ||||||
---|---|---|---|---|---|---|---|---|---|
Loading, please wait... |
Continue Researching MTEX
Want to see what other sources are saying about Mannatech Inc's financials and stock price? Try the links below:Mannatech Inc (MTEX) Stock Price | Nasdaq
Mannatech Inc (MTEX) Stock Quote, History and News - Yahoo Finance
Mannatech Inc (MTEX) Stock Price and Basic Information | MarketWatch
Loading social stream, please wait...