
MGIC Investment Corporation (MTG): Price and Financial Metrics
MTG Price/Volume Stats
| Current price | $24.88 | 52-week high | $24.90 |
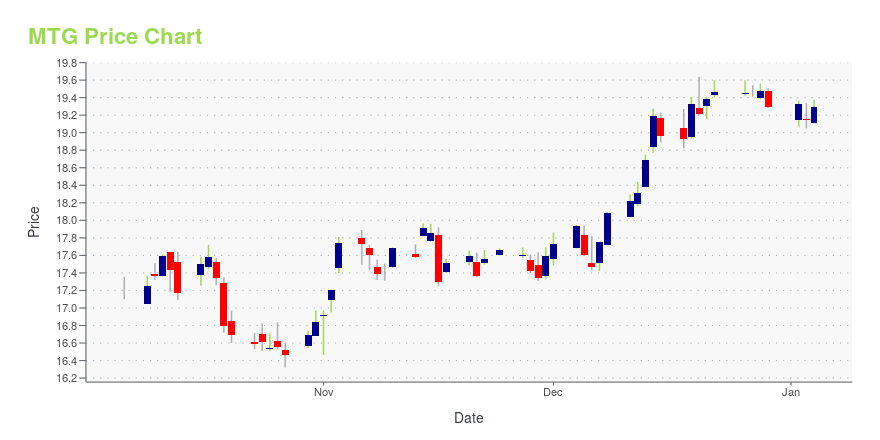
| Prev. close | $24.43 | 52-week low | $16.30 |
| Day low | $24.49 | Volume | 1,834,506 |
| Day high | $24.90 | Avg. volume | 1,881,334 |
| 50-day MA | $21.64 | Dividend yield | 1.95% |
| 200-day MA | $19.85 | Market Cap | 6.63B |
MTG Stock Price Chart Interactive Chart >
MGIC Investment Corporation (MTG) Company Bio
MGIC Investment Corporation provides private mortgage insurance and ancillary services to lenders and government sponsored entities in the United States. The company was founded in 1957 and is based in Milwaukee, Wisconsin.
Latest MTG News From Around the Web
Below are the latest news stories about MGIC INVESTMENT CORP that investors may wish to consider to help them evaluate MTG as an investment opportunity.
15 Best Mortgage Insurance Companies Heading into 2024In this article, we will look into the 15 best mortgage insurance companies heading into 2024. If you want to skip our detailed analysis, you can go directly to the 5 Best Mortgage Insurance Companies Heading into 2024. Mortgage Insurance Market Shift According to an article by National Mortgage News, published on August 7, 2023, […] |
4 Insurers With 25% Gains in 2023 Still Have Room to RunBanking on strong fundamentals and benefiting from a favorable macro backdrop, AIZ, MTG, NMIH and RDN have not only outperformed the industry but have also crushed the market and the Finance sector. These companies are well-poised to sustain the bull run next year. |
MGIC Investment (MTG) Up 33.2% in a Year: Will the Rally Last?MGIC Investment (MTG) stock rallies on the back of higher insurance in force, a decline in loss and claims payments, better housing market fundamentals and prudent capital deployment. |
Are Investors Undervaluing MGIC Investment (MTG) Right Now?Here at Zacks, our focus is on the proven Zacks Rank system, which emphasizes earnings estimates and estimate revisions to find great stocks. Nevertheless, we are always paying attention to the latest value, growth, and momentum trends to underscore strong picks. |
Why Is MetLife (MET) Up 6% Since Last Earnings Report?MetLife (MET) reported earnings 30 days ago. What's next for the stock? We take a look at earnings estimates for some clues. |
MTG Price Returns
| 1-mo | 17.86% |
| 3-mo | 22.15% |
| 6-mo | 25.46% |
| 1-year | 51.12% |
| 3-year | 98.57% |
| 5-year | 119.53% |
| YTD | 30.47% |
| 2023 | 52.41% |
| 2022 | -7.50% |
| 2021 | 17.20% |
| 2020 | -9.20% |
| 2019 | 36.71% |
MTG Dividends
| Ex-Dividend Date | Type | Payout Amount | Change | ||||||
|---|---|---|---|---|---|---|---|---|---|
| Loading, please wait... | |||||||||
Continue Researching MTG
Here are a few links from around the web to help you further your research on Mgic Investment Corp's stock as an investment opportunity:Mgic Investment Corp (MTG) Stock Price | Nasdaq
Mgic Investment Corp (MTG) Stock Quote, History and News - Yahoo Finance
Mgic Investment Corp (MTG) Stock Price and Basic Information | MarketWatch
Loading social stream, please wait...