Myers Industries, Inc. (MYE): Price and Financial Metrics
MYE Price/Volume Stats
Current price | $17.82 | 52-week high | $26.49 |
Prev. close | $17.97 | 52-week low | $16.08 |
Day low | $17.78 | Volume | 128,975 |
Day high | $18.14 | Avg. volume | 144,205 |
50-day MA | $18.74 | Dividend yield | 3% |
200-day MA | $20.64 | Market Cap | 655.95M |
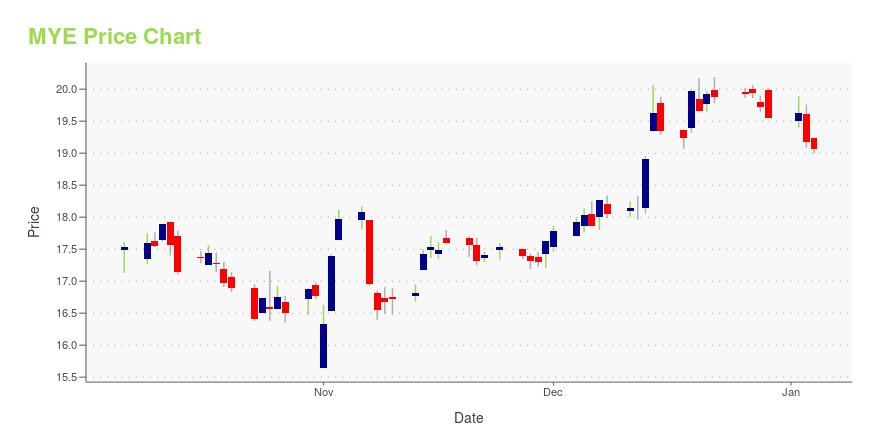
MYE Stock Price Chart Interactive Chart >
MYE POWR Grades
- Stability is the dimension where MYE ranks best; there it ranks ahead of 89.66% of US stocks.
- MYE's strongest trending metric is Stability; it's been moving up over the last 177 days.
- MYE's current lowest rank is in the Momentum metric (where it is better than 0.25% of US stocks).
MYE Stock Summary
- With a one year PEG ratio of 376.84, MYERS INDUSTRIES INC is expected to have a higher PEG ratio (a measure of how expensive a stock is relative to its expected earnings growth) than 92.24% of US stocks.
- MYE's went public 36.07 years ago, making it older than 91.92% of listed US stocks we're tracking.
- Of note is the ratio of MYERS INDUSTRIES INC's sales and general administrative expense to its total operating expenses; 97.18% of US stocks have a lower such ratio.
- Stocks with similar financial metrics, market capitalization, and price volatility to MYERS INDUSTRIES INC are MYRG, AYI, JBSS, ROCK, and DCI.
- Visit MYE's SEC page to see the company's official filings. To visit the company's web site, go to www.myersindustries.com.
MYE Valuation Summary
- In comparison to the median Consumer Cyclical stock, MYE's price/earnings ratio is 15.33% lower, now standing at 12.7.
- MYE's EV/EBIT ratio has moved down 3.5 over the prior 243 months.
Below are key valuation metrics over time for MYE.
Stock | Date | P/S | P/B | P/E | EV/EBIT |
---|---|---|---|---|---|
MYE | 2023-09-13 | 0.7 | 2.3 | 12.7 | 10.1 |
MYE | 2023-09-12 | 0.7 | 2.3 | 12.6 | 10.0 |
MYE | 2023-09-11 | 0.8 | 2.4 | 12.9 | 10.2 |
MYE | 2023-09-08 | 0.8 | 2.4 | 12.9 | 10.3 |
MYE | 2023-09-07 | 0.8 | 2.4 | 13.0 | 10.3 |
MYE | 2023-09-06 | 0.8 | 2.5 | 13.3 | 10.6 |
MYE Growth Metrics
- Its 4 year cash and equivalents growth rate is now at 358.68%.
- Its 5 year net cashflow from operations growth rate is now at -19.51%.
- The 5 year price growth rate now stands at -35.15%.

The table below shows MYE's growth in key financial areas (numbers in millions of US dollars).
Date | Revenue | Operating Cash Flow | Net Income to Common Stock |
---|---|---|---|
2022-09-30 | 886.286 | 82.129 | 54.094 |
2022-06-30 | 858.279 | 57.912 | 48.326 |
2022-03-31 | 812.492 | 45.618 | 43.57 |
2021-12-31 | 761.435 | 44.914 | 33.538 |
2021-09-30 | 699.323 | 28.717 | 29.273 |
2021-06-30 | 631.523 | 56.023 | 30.055 |
MYE's Quality Factors
The “Quality” component of the POWR Ratings focuses on 31 different factors of a companies fundamentals and operational strength. Here are some key insights as we drill into the specifics of these quality attributes.- MYE has a Quality Grade of B, ranking ahead of 75.85% of graded US stocks.
- MYE's asset turnover comes in at 1.562 -- ranking 3rd of 22 Rubber and Plastic Products stocks.
- BERY, NPO, and WMS are the stocks whose asset turnover ratios are most correlated with MYE.
The table below shows MYE's key quality metrics over time.
Period | Asset Turnover | Gross Margin | ROIC |
---|---|---|---|
2021-06-30 | 1.562 | 0.305 | 0.201 |
2021-03-31 | 1.460 | 0.320 | 0.211 |
2020-12-31 | 1.389 | 0.337 | 0.330 |
2020-09-30 | 1.376 | 0.350 | 0.368 |
2020-06-30 | 1.366 | 0.339 | 0.320 |
2020-03-31 | 1.413 | 0.337 | 0.291 |
MYE Price Target
For more insight on analysts targets of MYE, see our MYE price target page. And for a list of of all stocks sorted by upside potential based on analyst target price, see our Top Price Target page.
Average Price Target | $27.00 | Average Broker Recommendation | 1.5 (Moderate Buy) |
Myers Industries, Inc. (MYE) Company Bio
Myers Industries manufactures polymer products for industrial, agricultural, automotive, commercial, and consumer markets and also distributes tools, equipment, and supplies for the tire, wheel, and under-vehicle service industry in the U.S. The company was founded in 1933 and is based in Akron, Ohio.
Latest MYE News From Around the Web
Below are the latest news stories about MYERS INDUSTRIES INC that investors may wish to consider to help them evaluate MYE as an investment opportunity.
The 7 Most Undervalued Value Stocks to Buy in September 2023While chasing the hot stories of the moment is fun, astute investors may get further with enticing undervalued value stocks. |
Myers Industries Inc: A Deep Dive into Its Dividend Performance and SustainabilityMyers Industries Inc (NYSE:MYE) recently announced a dividend of $0.14 per share, payable on 2023-10-04, with the ex-dividend date set for 2023-09-12. As investors anticipate this forthcoming payment, the company's dividend history, yield, and growth rates have come under the spotlight. This article uses GuruFocus data to delve into Myers Industries Inc's dividend performance and assess its sustainability. |
Gabelli Funds to Host 47th Annual Automotive Symposium at The Encore at Wynn, Las Vegas, NevadaRYE, N.Y., Sept. 11, 2023 (GLOBE NEWSWIRE) -- Gabelli Funds will host the 47th Annual Automotive Symposium on October 30th and 31st, 2023 at the Encore at Wynn in Las Vegas, Nevada. This two-day symposium will feature presentations by senior managements of leading automotive and trucking companies, with a lineup that enables investors to understand ever-changing dynamics within the automotive industry. Presenting attendees, which include original equipment suppliers, automotive retailers, afterm |
Myers Industries (NYSE:MYE) Is Due To Pay A Dividend Of $0.135The board of Myers Industries, Inc. ( NYSE:MYE ) has announced that it will pay a dividend of $0.135 per share on the... |
Be Sure To Check Out Myers Industries, Inc. (NYSE:MYE) Before It Goes Ex-DividendRegular readers will know that we love our dividends at Simply Wall St, which is why it's exciting to see Myers... |
MYE Price Returns
1-mo | -2.73% |
3-mo | -6.62% |
6-mo | -15.35% |
1-year | 9.10% |
3-year | 48.37% |
5-year | -14.33% |
YTD | -18.12% |
2022 | 14.03% |
2021 | -1.12% |
2020 | 29.44% |
2019 | 13.86% |
2018 | -20.38% |
MYE Dividends
Ex-Dividend Date | Type | Payout Amount | Change | ||||||
---|---|---|---|---|---|---|---|---|---|
Loading, please wait... |
Continue Researching MYE
Here are a few links from around the web to help you further your research on Myers Industries Inc's stock as an investment opportunity:Myers Industries Inc (MYE) Stock Price | Nasdaq
Myers Industries Inc (MYE) Stock Quote, History and News - Yahoo Finance
Myers Industries Inc (MYE) Stock Price and Basic Information | MarketWatch
Loading social stream, please wait...