
Nordic American Tankers Limited (NAT): Price and Financial Metrics
NAT Price/Volume Stats
| Current price | $3.64 | 52-week high | $4.83 |
| Prev. close | $3.73 | 52-week low | $3.61 |
| Day low | $3.61 | Volume | 4,904,400 |
| Day high | $3.74 | Avg. volume | 2,665,292 |
| 50-day MA | $3.99 | Dividend yield | 12.4% |
| 200-day MA | $4.13 | Market Cap | 760.02M |
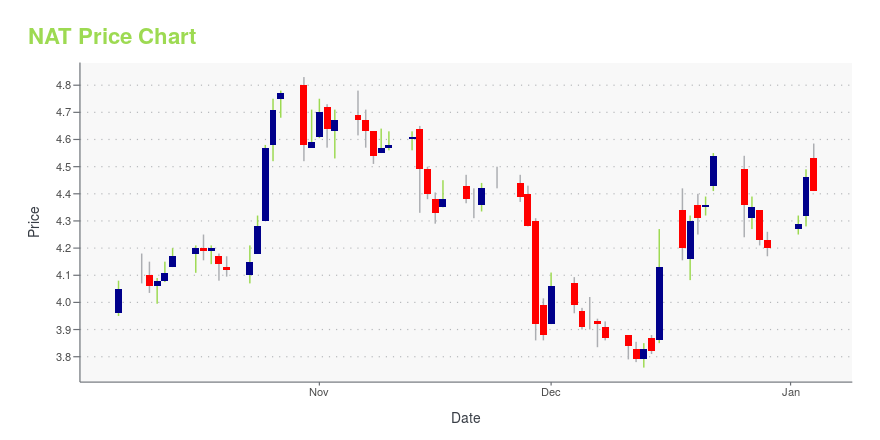
NAT Stock Price Chart Interactive Chart >
Nordic American Tankers Limited (NAT) Company Bio
Nordic American Tankers Ltd is an American shipping company. It operates as an independent Suez-max tanker owner and operator, offering services through various routes worldwide. The company was founded in 1995 in Bermuda, where it still maintains its headquarters in Hamilton. Nordic American began its operational history with three Suez-max tankers built by Samsung Heavy Industries Co. Ltd., the Nordic Hawk, the Nordic Hunter, and the Nordic Harrier. Since the late 1990’s, the company has expanded its fleet and it operates a total of 33 crude Suez-max tankers today. Herbjorn Hansson has served as Nordic American’s Chief Executive Officer since the company’s inception and the firm has 20 employees on its payroll.
Latest NAT News From Around the Web
Below are the latest news stories about NORDIC AMERICAN TANKERS LTD that investors may wish to consider to help them evaluate NAT as an investment opportunity.
Nordic American Tankers Ltd's Dividend AnalysisAs investors look forward to this upcoming payment, the spotlight also shines on the company's dividend history, yield, and growth rates. Using the data from GuruFocus, let's look into Nordic American Tankers Ltd's dividend performance and assess its sustainability. What Does Nordic American Tankers Ltd Do? |
Nordic American Tankers Ltd (NYSE: NAT) – Greetings for the SeasonThursday, December 14, 2023 Dear Shareholders and Investors, As we are approaching the end of the year, we enjoy a solid market, the best we have seen for decades. The last year has once again proven that our fleet of versatile Suezmax tankers is the right equipment for changing geopolitical circumstances. For information about NAT, our fleet and our strategy, please visit our website: www.nat.bm On behalf of my colleagues and me, we would like to wish our shareholders, customers and friends all |
Those who invested in Nordic American Tankers (NYSE:NAT) five years ago are up 103%Nordic American Tankers Limited ( NYSE:NAT ) shareholders might be concerned after seeing the share price drop 16% in... |
Correction: Nordic American Tankers Ltd (NYSE: NAT) – Board Member Alexander Hansson buys more NAT sharesThursday, November 30, 2023 Dear Shareholders and Investors, Alexander Hansson, Board Member of Nordic American Tankers Ltd (NAT) and son of Herbjorn Hansson, the NAT Founder, Chairman and CEO, has today bought 100,000 shares in NAT at $3.93 per share. Following these transactions, Monaco based Alexander Hansson privately owns 2,250,000 shares in NAT. As in the past, the Hansson family is the largest private shareholder group in the company. For contacts, please see at the end of this communicat |
Nordic American Tankers Ltd (NYSE: NAT) –Thursday, November 30, 2023 Dear Shareholders and Investors, Alexander Hansson, Board Member of Nordic American Tankers Ltd (NAT) and son of Herbjorn Hansson, the NAT Founder, Chairman and CEO, has today bought 100,000 shares in NAT at $3.93 per share. Following these transactions, Monaco based Alexander Hansson privately owns 2,250,000 shares in NAT. As in the past, the Hansson family is the largest private shareholder group in the company. For contacts, please see at the end of this communicat |
NAT Price Returns
| 1-mo | -10.31% |
| 3-mo | -5.57% |
| 6-mo | -13.94% |
| 1-year | -1.02% |
| 3-year | 77.54% |
| 5-year | 149.71% |
| YTD | -8.00% |
| 2023 | 55.83% |
| 2022 | 87.91% |
| 2021 | -41.49% |
| 2020 | -32.82% |
| 2019 | 156.48% |
NAT Dividends
| Ex-Dividend Date | Type | Payout Amount | Change | ||||||
|---|---|---|---|---|---|---|---|---|---|
| Loading, please wait... | |||||||||
Continue Researching NAT
Want to see what other sources are saying about NORDIC AMERICAN TANKERS Ltd's financials and stock price? Try the links below:NORDIC AMERICAN TANKERS Ltd (NAT) Stock Price | Nasdaq
NORDIC AMERICAN TANKERS Ltd (NAT) Stock Quote, History and News - Yahoo Finance
NORDIC AMERICAN TANKERS Ltd (NAT) Stock Price and Basic Information | MarketWatch
Loading social stream, please wait...