Neurocrine Biosciences, Inc. (NBIX): Price and Financial Metrics
NBIX Price/Volume Stats
Current price | $117.28 | 52-week high | $125.01 |
Prev. close | $120.00 | 52-week low | $89.04 |
Day low | $117.23 | Volume | 528,300 |
Day high | $120.32 | Avg. volume | 743,283 |
50-day MA | $112.39 | Dividend yield | N/A |
200-day MA | $103.72 | Market Cap | 11.52B |
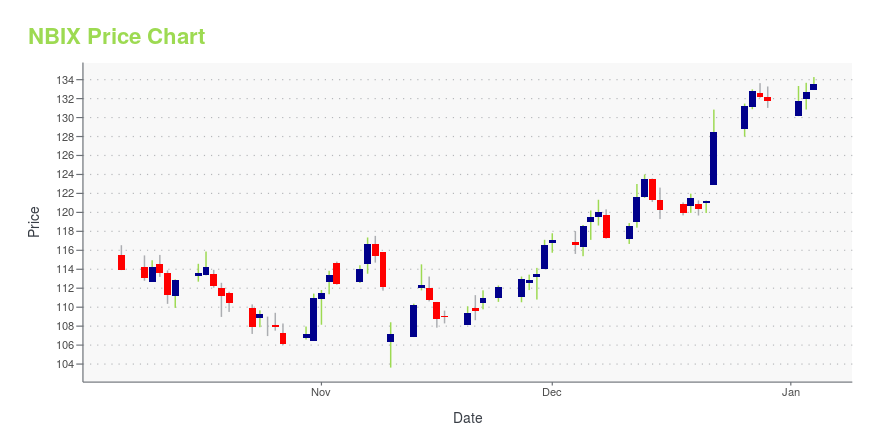
NBIX Stock Price Chart Interactive Chart >
NBIX POWR Grades
- NBIX scores best on the Quality dimension, with a Quality rank ahead of 96.93% of US stocks.
- NBIX's strongest trending metric is Quality; it's been moving up over the last 177 days.
- NBIX's current lowest rank is in the Momentum metric (where it is better than 15.96% of US stocks).
NBIX Stock Summary
- NBIX's current price/earnings ratio is 60.25, which is higher than 89.65% of US stocks with positive earnings.
- Price to trailing twelve month operating cash flow for NBIX is currently 28.11, higher than 85.58% of US stocks with positive operating cash flow.
- In terms of twelve month growth in earnings before interest and taxes, NEUROCRINE BIOSCIENCES INC is reporting a growth rate of 170.46%; that's higher than 92.94% of US stocks.
- Stocks that are quantitatively similar to NBIX, based on their financial statements, market capitalization, and price volatility, are DV, ITRI, COHU, ONTO, and THRM.
- Visit NBIX's SEC page to see the company's official filings. To visit the company's web site, go to www.neurocrine.com.
NBIX Valuation Summary
- In comparison to the median Healthcare stock, NBIX's price/sales ratio is 224.32% higher, now standing at 6.
- NBIX's EV/EBIT ratio has moved up 66.7 over the prior 243 months.
Below are key valuation metrics over time for NBIX.
Stock | Date | P/S | P/B | P/E | EV/EBIT |
---|---|---|---|---|---|
NBIX | 2023-11-20 | 6.0 | 5.4 | 56.3 | 41.8 |
NBIX | 2023-11-17 | 6.0 | 5.3 | 56.0 | 41.6 |
NBIX | 2023-11-16 | 6.0 | 5.3 | 56.0 | 41.5 |
NBIX | 2023-11-15 | 6.1 | 5.4 | 57.0 | 42.3 |
NBIX | 2023-11-14 | 6.2 | 5.5 | 57.8 | 42.9 |
NBIX | 2023-11-13 | 6.1 | 5.4 | 56.7 | 42.1 |
NBIX Growth Metrics
- Its 3 year price growth rate is now at 15.15%.
- The year over year net cashflow from operations growth rate now stands at -53.64%.
- Its 3 year net cashflow from operations growth rate is now at 370.41%.

The table below shows NBIX's growth in key financial areas (numbers in millions of US dollars).
Date | Revenue | Operating Cash Flow | Net Income to Common Stock |
---|---|---|---|
2022-12-31 | 1,488.7 | 339.4 | 154.5 |
2022-09-30 | 1,388.7 | 200.6 | 58.2 |
2022-06-30 | 1,296.8 | 163.6 | 12.2 |
2022-03-31 | 1,207.5 | 128.7 | 71.4 |
2021-12-31 | 1,133.5 | 256.5 | 89.6 |
2021-09-30 | 1,069.4 | 341.2 | 444.8 |
NBIX's Quality Factors
The “Quality” component of the POWR Ratings focuses on 31 different factors of a companies fundamentals and operational strength. Here are some key insights as we drill into the specifics of these quality attributes.- NBIX has a Quality Grade of B, ranking ahead of 78.08% of graded US stocks.
- NBIX's asset turnover comes in at 0.566 -- ranking 66th of 682 Pharmaceutical Products stocks.
- LGND, MNKD, and MRK are the stocks whose asset turnover ratios are most correlated with NBIX.
The table below shows NBIX's key quality metrics over time.
Period | Asset Turnover | Gross Margin | ROIC |
---|---|---|---|
2021-09-30 | 0.566 | 0.988 | 0.102 |
2021-06-30 | 0.586 | 0.989 | 0.063 |
2021-03-31 | 0.634 | 0.990 | 0.092 |
2020-12-31 | 0.684 | 0.990 | 0.105 |
2020-09-30 | 0.733 | 0.991 | 0.118 |
2020-06-30 | 0.750 | 0.991 | 0.199 |
NBIX Price Target
For more insight on analysts targets of NBIX, see our NBIX price target page. And for a list of of all stocks sorted by upside potential based on analyst target price, see our Top Price Target page.
Average Price Target | $122.19 | Average Broker Recommendation | 1.52 (Moderate Buy) |
Neurocrine Biosciences, Inc. (NBIX) Company Bio
Neurocrine Biosciences discovers and develops pharmaceuticals for the treatment of neurological and endocrine-related diseases and disorders in the United States. The company was founded in 1992 and is based in San Diego, California.
Latest NBIX News From Around the Web
Below are the latest news stories about NEUROCRINE BIOSCIENCES INC that investors may wish to consider to help them evaluate NBIX as an investment opportunity.
Neurocrine Biosciences Receives Breakthrough Therapy Designation from U.S. Food and Drug Administration for Crinecerfont in Congenital Adrenal HyperplasiaNeurocrine Biosciences, Inc. (Nasdaq: NBIX) today announced it received Breakthrough Therapy designation from the U.S. Food and Drug Administration (FDA) for crinecerfont in congenital adrenal hyperplasia. The Company also provided updates on its R&D portfolio and strategy at its Analyst Day, held in New York. |
Insider Sell Alert: Chief Scientific Officer Jude Onyia Sells Shares of Neurocrine Biosciences IncNeurocrine Biosciences Inc (NASDAQ:NBIX), a prominent player in the biopharmaceutical industry, has recently witnessed a significant insider sell event. |
Neurocrine Biosciences to Host Analyst Day on December 5, 2023Neurocrine Biosciences, Inc. (Nasdaq: NBIX), a leading neuroscience-focused biopharmaceutical company, will hold its Analyst Day focused on its R&D portfolio and strategy on Tuesday, December 5, 2023 in New York. The event will be held in-person and via webcast. It will feature Kevin Gorman, Chief Executive Officer, and Jude Onyia, Chief Scientific Officer, as well as additional members of Neurocrine Biosciences' management team who will facilitate a panel discussion on the burden of congenital |
Neurocrine Biosciences Inc's Chief Legal Officer Darin Lippoldt Sells Shares: An Insider AnalysisNeurocrine Biosciences Inc (NASDAQ:NBIX), a prominent player in the biopharmaceutical industry, has recently witnessed a significant insider sell by its Chief Legal Officer, Darin Lippoldt. |
12 Best Low Beta Stocks To BuyIn this piece, we will take a look at the 12 best low beta stocks to buy. If you want to skip our introduction to the latest stock market news and the beta, then take a look at the 5 Best Low Beta Stocks To Buy. If there’s one thing that can be said with […] |
NBIX Price Returns
1-mo | 4.57% |
3-mo | 7.33% |
6-mo | 25.45% |
1-year | 0.03% |
3-year | 27.52% |
5-year | 36.67% |
YTD | -1.81% |
2022 | 40.24% |
2021 | -11.14% |
2020 | -10.83% |
2019 | 50.53% |
2018 | -7.96% |
Continue Researching NBIX
Want to do more research on Neurocrine Biosciences Inc's stock and its price? Try the links below:Neurocrine Biosciences Inc (NBIX) Stock Price | Nasdaq
Neurocrine Biosciences Inc (NBIX) Stock Quote, History and News - Yahoo Finance
Neurocrine Biosciences Inc (NBIX) Stock Price and Basic Information | MarketWatch
Loading social stream, please wait...