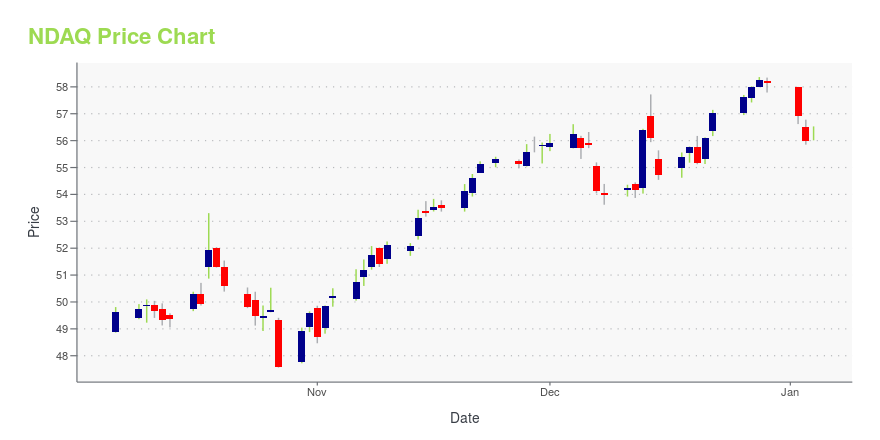
Nasdaq Inc. (NDAQ): Price and Financial Metrics
NDAQ Price/Volume Stats
| Current price | $66.96 | 52-week high | $67.77 |
| Prev. close | $67.26 | 52-week low | $46.88 |
| Day low | $66.26 | Volume | 3,629,800 |
| Day high | $67.66 | Avg. volume | 2,822,963 |
| 50-day MA | $61.00 | Dividend yield | 1.52% |
| 200-day MA | $57.80 | Market Cap | 38.52B |
NDAQ Stock Price Chart Interactive Chart >
Nasdaq Inc. (NDAQ) Company Bio
Nasdaq, Inc. is an American multinational financial services corporation that owns and operates three stock exchanges in the United States: the namesake Nasdaq stock exchange, the Philadelphia Stock Exchange, and the Boston Stock Exchange, and seven European stock exchanges: Nasdaq Copenhagen, Nasdaq Helsinki, Nasdaq Iceland, Nasdaq Riga, Nasdaq Stockholm, Nasdaq Tallinn, and Nasdaq Vilnius. It is headquartered in New York City, and its president and chief executive officer is Adena Friedman. (Source:Wikipedia)
Latest NDAQ News From Around the Web
Below are the latest news stories about NASDAQ INC that investors may wish to consider to help them evaluate NDAQ as an investment opportunity.
Nasdaq Announces Mid-Month Open Short Interest Positions in Nasdaq Stocks as of Settlement Date December 15, 2023Nasdaq Short Interest Days Nasdaq Short Interest Days NEW YORK, Dec. 27, 2023 (GLOBE NEWSWIRE) -- At the end of the settlement date of December 15, 2023, short interest in 3,191 Nasdaq Global MarketSM securities totaled 10,832,646,277 shares compared with 10,851,113,277 shares in 3,183 Global Market issues reported for the prior settlement date of November 30, 2023. The mid-December short interest represents 2.88 days compared with 3.51 days for the prior reporting period. Short interest in 1,73 |
Delisting of Securities of SmileDirectClub, Inc.; Bellerophon Therapeutics, Inc.; Elys Game Technology, Corp.’; Athersys, Inc.; Borqs Technologies, Inc.; ContraFect Corporation; CohBar, Inc.; AgileThought, Inc.; Fat Projects Acquisition Corp.; Evelo Biosciences, Inc.; Troika Media Group, Inc.; Impel Pharmaceuticals Inc.; Fresh Tracks Therapeutics, Inc.; and Near Intelligence, Inc. from The Nasdaq Stock MarketNEW YORK, Dec. 26, 2023 (GLOBE NEWSWIRE) -- The Nasdaq Stock Market announced today that it will delist the common stock of SmileDirectClub, Inc. SmileDirectClub, Inc.’s securities were suspended on October 4, 2023, and have not traded on Nasdaq since that time. Nasdaq also announced today that it will delist the common stock of Bellerophon Therapeutics, Inc. Bellerophon Therapeutics, Inc.’s securities were suspended on October 16, 2023, and have not traded on Nasdaq since that time. Nasdaq also |
Nasdaq to Host 2024 Investor DayNEW YORK, Dec. 21, 2023 (GLOBE NEWSWIRE) -- Nasdaq (Nasdaq: NDAQ) today announced that it will host its 2024 Investor Day on Tuesday, March 5, 2024. The event will feature presentations on the company’s operations and strategy, as well as question and answer sessions, with members of Nasdaq’s senior leadership team including Adena Friedman, Chair and CEO, and Sarah Youngwood, Executive Vice President and CFO. The Investor Day will be held at Nasdaq’s Global Headquarters in Times Square, New York |
Nasdaq to Hold Fourth Quarter 2023 Investor Conference CallNEW YORK, Dec. 21, 2023 (GLOBE NEWSWIRE) -- Nasdaq (Nasdaq: NDAQ) has scheduled its Fourth Quarter 2023 financial results announcement. WHO: Nasdaq’s CEO, CFO, and additional members of its senior management team WHAT:Review Nasdaq’s Fourth Quarter 2023 financial results WHEN: Wednesday, January 31, 2024 Results Call: 8:00 AM Eastern Senior management will be available for questions from the investment community following prepared remarks. All participants can access the conference via webcast t |
Swedish Traders Press Nasdaq for Shorter Hours, More Work-Life Balance(Bloomberg) -- Nasdaq Inc. is facing calls from Swedish traders to trim trading hours on the biggest stock market in the Nordics for improved work-life balance and to attract new talent.Most Read from BloombergVilified Zero-Day Options Blamed by Traders for S&P DeclineStocks Rebound as Economy Shows Signs of Cooling: Markets WrapUS Inflation Report to Show Fed’s Battle Is Now All But CompleteHarvard’s Financial Strain Grows as Blavatnik Joins Donor RevoltOnce Africa’s Richest Woman, Dos Santos H |
NDAQ Price Returns
| 1-mo | 12.05% |
| 3-mo | 11.83% |
| 6-mo | 15.12% |
| 1-year | 35.35% |
| 3-year | 12.92% |
| 5-year | 120.86% |
| YTD | 16.07% |
| 2023 | -3.66% |
| 2022 | -11.19% |
| 2021 | 60.13% |
| 2020 | 25.99% |
| 2019 | 33.88% |
NDAQ Dividends
| Ex-Dividend Date | Type | Payout Amount | Change | ||||||
|---|---|---|---|---|---|---|---|---|---|
| Loading, please wait... | |||||||||
Continue Researching NDAQ
Want to see what other sources are saying about Nasdaq Inc's financials and stock price? Try the links below:Nasdaq Inc (NDAQ) Stock Price | Nasdaq
Nasdaq Inc (NDAQ) Stock Quote, History and News - Yahoo Finance
Nasdaq Inc (NDAQ) Stock Price and Basic Information | MarketWatch


Loading social stream, please wait...