
Nordson Corporation (NDSN): Price and Financial Metrics
NDSN Price/Volume Stats
| Current price | $245.95 | 52-week high | $279.38 |
| Prev. close | $240.55 | 52-week low | $208.91 |
| Day low | $241.64 | Volume | 234,400 |
| Day high | $247.38 | Avg. volume | 232,890 |
| 50-day MA | $236.17 | Dividend yield | 1.13% |
| 200-day MA | $247.56 | Market Cap | 14.09B |
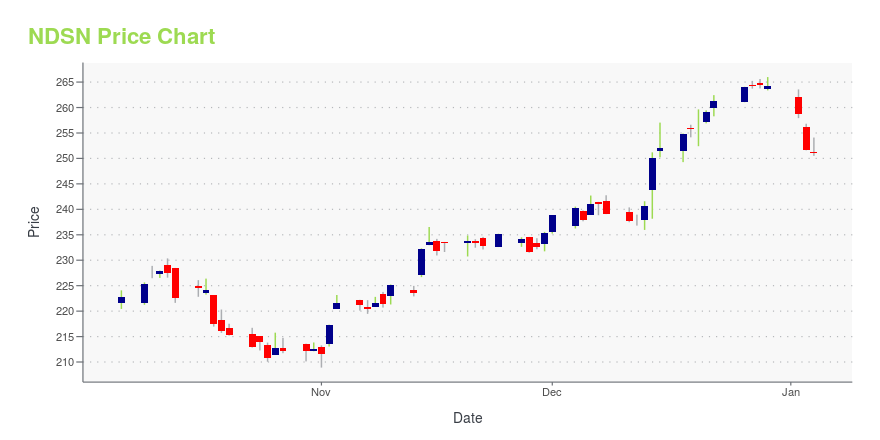
NDSN Stock Price Chart Interactive Chart >
Nordson Corporation (NDSN) Company Bio
Nordson Corporation engineers, manufactures and markets differentiated products and systems used for the precision dispensing of adhesives, coatings, sealants, biomaterials, polymers, plastics and other materials, fluid management, test and inspection, UV curing and plasma surface treatment, serving a wide variety of consumer non-durable, durable and technology end markets including packaging, nonwovens, electronics, medical, appliances, energy, transportation, construction, and general product assembly and finishing. The company was founded in 1935 and is based in Westlake, Ohio.
Latest NDSN News From Around the Web
Below are the latest news stories about NORDSON CORP that investors may wish to consider to help them evaluate NDSN as an investment opportunity.
Nordson Corporation (NASDAQ:NDSN) Just Released Its Full-Year Earnings: Here's What Analysts ThinkInvestors in Nordson Corporation ( NASDAQ:NDSN ) had a good week, as its shares rose 3.7% to close at US$261 following... |
26 Best Stocks For DividendsIn this article, we discuss 26 best stocks for dividends. You can skip our detailed analysis of dividend stocks and their previous performance, and go directly to read 10 Best Stocks For Dividends. As we near the close of 2023, investors are actively diversifying their portfolios by exploring various investment strategies. One noticeable trend this […] |
Decoding Nordson Corp (NDSN): A Strategic SWOT InsightUncovering the Financial Dynamics and Strategic Directions of Nordson Corp |
Nordson Corporation (NASDAQ:NDSN) Q4 2023 Earnings Call TranscriptNordson Corporation (NASDAQ:NDSN) Q4 2023 Earnings Call Transcript December 14, 2023 Operator: Good morning. My name is Dennis and I will be your conference operator today. At this time, I would like to welcome everyone to the Nordson Corporation Fourth Quarter and Fiscal Year 2023 Conference Call. All lines have been placed on mute to […] |
Nordson Corp's Dividend AnalysisAs investors look forward to this upcoming payment, the spotlight also shines on the company's dividend history, yield, and growth rates. Using the data from GuruFocus, let's look into Nordson Corp's dividend performance and assess its sustainability. What Does Nordson Corp Do? |
NDSN Price Returns
| 1-mo | 7.02% |
| 3-mo | -5.31% |
| 6-mo | -1.98% |
| 1-year | 0.20% |
| 3-year | 14.56% |
| 5-year | 82.03% |
| YTD | -6.42% |
| 2023 | 12.39% |
| 2022 | -5.93% |
| 2021 | 28.09% |
| 2020 | 24.45% |
| 2019 | 37.88% |
NDSN Dividends
| Ex-Dividend Date | Type | Payout Amount | Change | ||||||
|---|---|---|---|---|---|---|---|---|---|
| Loading, please wait... | |||||||||
Continue Researching NDSN
Want to do more research on Nordson Corp's stock and its price? Try the links below:Nordson Corp (NDSN) Stock Price | Nasdaq
Nordson Corp (NDSN) Stock Quote, History and News - Yahoo Finance
Nordson Corp (NDSN) Stock Price and Basic Information | MarketWatch
Loading social stream, please wait...