Newmont Corp. (NEM): Price and Financial Metrics

Newmont Corp. (NEM): $40.74

0.22 (+0.54%)

POWR Rating

Component Grades

Momentum

C

Stability

C

Sentiment

Quality

C

Add NEM to Watchlist
Sign Up

Industry: Miners - Gold

Industry

B

Ranked

#28 of 40

in industry

NEM Price/Volume Stats

Current price $40.74 52-week high $60.08
Prev. close $40.52 52-week low $37.45
Day low $40.74 Volume 6,411,200
Day high $41.23 Avg. volume 7,777,105
50-day MA $40.50 Dividend yield 3.95%
200-day MA $45.18 Market Cap 32.38B

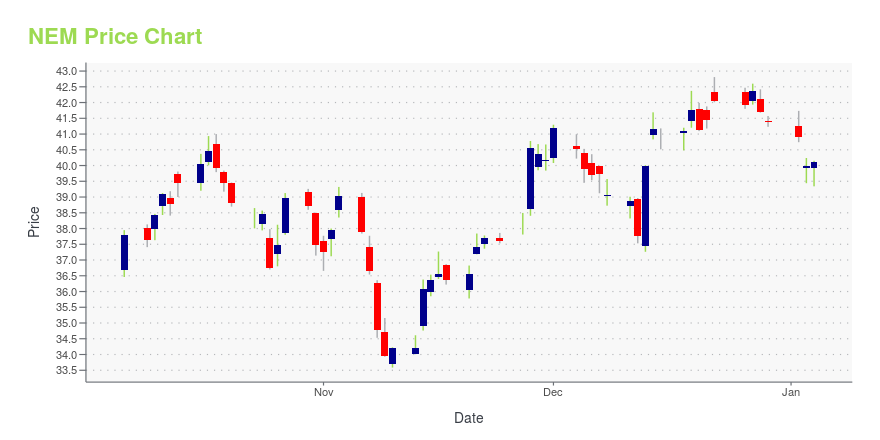
NEM Stock Price Chart Interactive Chart >

NEM POWR Grades

  • Quality is the dimension where NEM ranks best; there it ranks ahead of 72.69% of US stocks.
  • The strongest trend for NEM is in Sentiment, which has been heading down over the past 179 days.
  • NEM's current lowest rank is in the Sentiment metric (where it is better than 0.6% of US stocks).

NEM Stock Summary

  • With a market capitalization of $32,162,821,968, NEWMONT CORP has a greater market value than 92.8% of US stocks.
  • NEWMONT CORP's stock had its IPO on January 1, 1986, making it an older stock than 93.16% of US equities in our set.
  • Of note is the ratio of NEWMONT CORP's sales and general administrative expense to its total operating expenses; merely 2.34% of US stocks have a lower such ratio.
  • Stocks with similar financial metrics, market capitalization, and price volatility to NEWMONT CORP are AEM, MRO, SM, IRWD, and DVN.
  • NEM's SEC filings can be seen here. And to visit NEWMONT CORP's official web site, go to www.newmont.com.

NEM Valuation Summary

  • In comparison to the median Basic Materials stock, NEM's EV/EBIT ratio is 4870.42% higher, now standing at 705.8.
  • Over the past 243 months, NEM's price/sales ratio has gone down 2.

Below are key valuation metrics over time for NEM.

Stock Date P/S P/B P/E EV/EBIT
NEM 2023-09-06 2.7 1.6 -40.4 705.8
NEM 2023-09-05 2.8 1.6 -40.7 711.4
NEM 2023-09-01 2.8 1.6 -41.2 719.4
NEM 2023-08-31 2.8 1.6 -41.3 721.1
NEM 2023-08-30 2.8 1.6 -41.7 726.7
NEM 2023-08-29 2.8 1.6 -41.4 722.7

NEM Growth Metrics

    Its year over year revenue growth rate is now at 4.96%.
  • The 5 year cash and equivalents growth rate now stands at 27.06%.
  • The 5 year net income to common stockholders growth rate now stands at 659.24%.
Over the past 52 months, NEM's revenue has gone up $4,775,000,000.

The table below shows NEM's growth in key financial areas (numbers in millions of US dollars).

Date Revenue Operating Cash Flow Net Income to Common Stock
2022-12-31 11,915 3,220 -429
2022-09-30 12,105 3,509 1,002
2022-06-30 12,366 4,180 792
2022-03-31 12,373 4,132 1,055
2021-12-31 12,222 4,279 1,166
2021-09-30 12,213 4,666 2,036

NEM's Quality Factors

The “Quality” component of the POWR Ratings focuses on 31 different factors of a companies fundamentals and operational strength. Here are some key insights as we drill into the specifics of these quality attributes.
  • NEM has a Quality Grade of B, ranking ahead of 80.3% of graded US stocks.
  • NEM's asset turnover comes in at 0.3 -- ranking 19th of 47 Precious Metals stocks.
  • EXK, GOLD, and FNV are the stocks whose asset turnover ratios are most correlated with NEM.

The table below shows NEM's key quality metrics over time.

Period Asset Turnover Gross Margin ROIC
2021-09-30 0.300 0.570 0.093
2021-06-30 0.305 0.587 0.118
2021-03-31 0.290 0.582 0.104
2020-12-31 0.285 0.564 0.103
2020-09-30 0.277 0.538 0.091
2020-06-30 0.265 0.507 0.131

NEM Price Target

For more insight on analysts targets of NEM, see our NEM price target page. And for a list of of all stocks sorted by upside potential based on analyst target price, see our Top Price Target page.

Average Price Target $74.11 Average Broker Recommendation 1.55 (Moderate Buy)

Newmont Corp. (NEM) Company Bio


Newmont, based in Greenwood Village, Colorado, United States, is the world's largest gold mining company. Incorporated in 1921, it has ownership of gold mines in NevadaColoradoOntarioQuebecMexico, the Dominican RepublicAustraliaGhanaArgentinaPeru, and Suriname. In addition to gold, Newmont mines coppersilverzinc and lead. (Source:Wikipedia)


NEM Latest News Stream


Event/Time News Detail
Loading, please wait...

NEM Latest Social Stream


Loading social stream, please wait...

View Full NEM Social Stream

Latest NEM News From Around the Web

Below are the latest news stories about NEWMONT CORP that investors may wish to consider to help them evaluate NEM as an investment opportunity.

Quant Ratings Updated on 98 Stocks

The fact is a lot of the distractions that have been weighing on the stock market in early September are starting to disappear...

Louis Navellier on InvestorPlace | September 19, 2023

Newmont Corporation (NEM) Dips More Than Broader Markets: What You Should Know

In the latest trading session, Newmont Corporation (NEM) closed at $40.29, marking a -0.44% move from the previous day.

Yahoo | September 19, 2023

Newmont's (NEM) Newcrest Deal Advances With Regulatory Approvals

Newmont (NEM) received regulatory clearance for acquiring Newcrest with approvals from Australia's FIRB and Japan's JFTC.

Yahoo | September 19, 2023

ASX shares dip amid interest rate concerns, energy sector rallies

On Tuesday, the Australian Securities Exchange (ASX) witnessed a decrease in its local shares by nearly half a percent, continuing an overall downward trend. This downturn coincided with the release of the Reserve Bank of Australia's (RBA) September minutes, which revealed that board members had chosen to maintain steady rates due to significant increases in interest rates over a short duration.

Yahoo | September 19, 2023

3 Stocks to Buy Before the FOMC Meeting Concludes on Sept. 20

These are the stocks to buy before the FOMC meeting ends with a likely rate hike pause set to trigger a rally for these strong names

Faisal Humayun on InvestorPlace | September 18, 2023

Read More 'NEM' Stories Here

NEM Price Returns

1-mo 7.45%
3-mo -3.71%
6-mo -14.56%
1-year 2.95%
3-year -25.74%
5-year 54.26%
YTD -11.08%
2022 -20.77%
2021 7.40%
2020 40.28%
2019 30.52%
2018 -6.15%

NEM Dividends

Ex-Dividend Date Type Payout Amount Change
Loading, please wait...
View Full NEM Dividend History

Get Free Updates

Join thousands of investors who get the latest news, insights and top rated picks from StockNews.com!