Nexa Resources S.A. (NEXA): Price and Financial Metrics
GET POWR RATINGS... FREE!
NEXA POWR Grades
- NEXA scores best on the Value dimension, with a Value rank ahead of 91.6% of US stocks.
- The strongest trend for NEXA is in Growth, which has been heading down over the past 177 days.
- NEXA ranks lowest in Growth; there it ranks in the 16th percentile.
NEXA Stock Summary
- Price to trailing twelve month operating cash flow for NEXA is currently 1.59, higher than just 6.99% of US stocks with positive operating cash flow.
- With a price/sales ratio of 0.26, NEXA RESOURCES SA has a higher such ratio than just 8.9% of stocks in our set.
- Shareholder yield, a measure of how much is returned to shareholders via dividends and share repurchases, for NEXA comes in at 19.23% -- higher than that of 90.47% of stocks in our set.
- If you're looking for stocks that are quantitatively similar to NEXA RESOURCES SA, a group of peers worth examining would be NGD, ALSN, HL, AMKR, and MESO.
- NEXA's SEC filings can be seen here. And to visit NEXA RESOURCES SA's official web site, go to www.nexaresources.com.
NEXA Valuation Summary
- NEXA's price/sales ratio is 0.3; this is 75% lower than that of the median Basic Materials stock.
- NEXA's EV/EBIT ratio has moved down 4.4 over the prior 66 months.
Below are key valuation metrics over time for NEXA.
Stock | Date | P/S | P/B | P/E | EV/EBIT |
---|---|---|---|---|---|
NEXA | 2023-03-24 | 0.3 | 0.6 | 16.2 | 5.3 |
NEXA | 2023-03-23 | 0.3 | 0.6 | 16.3 | 5.4 |
NEXA | 2023-03-22 | 0.3 | 0.5 | 16.0 | 5.3 |
NEXA | 2023-03-21 | 0.3 | 0.6 | 16.3 | 5.4 |
NEXA | 2023-03-20 | 0.3 | 0.5 | 15.9 | 5.3 |
NEXA | 2023-03-17 | 0.2 | 0.5 | 15.0 | 5.2 |
NEXA's Quality Factors
The “Quality” component of the POWR Ratings focuses on 31 different factors of a companies fundamentals and operational strength. Here are some key insights as we drill into the specifics of these quality attributes.- NEXA has a Quality Grade of B, ranking ahead of 76.47% of graded US stocks.
- NEXA's asset turnover comes in at 0.37 -- ranking 20th of 42 Non-Metallic and Industrial Metal Mining stocks.
- 500 - Internal server error
The table below shows NEXA's key quality metrics over time.
Period | Asset Turnover | Gross Margin | ROIC |
---|---|---|---|
2020-12-31 | 0.370 | 0.198 | -0.104 |
2019-12-31 | 0.416 | 0.166 | -0.019 |
2018-12-31 | 0.426 | 0.242 | 0.063 |
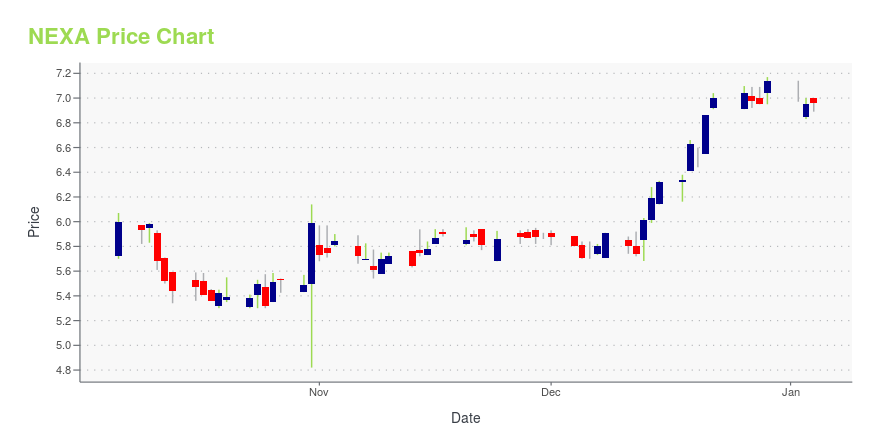
NEXA Stock Price Chart Interactive Chart >
NEXA Price/Volume Stats
Current price | $6.06 | 52-week high | $10.54 |
Prev. close | $6.12 | 52-week low | $4.27 |
Day low | $5.94 | Volume | 42,365 |
Day high | $6.15 | Avg. volume | 110,279 |
50-day MA | $6.48 | Dividend yield | 5.53% |
200-day MA | $5.92 | Market Cap | 802.59M |
Nexa Resources S.A. (NEXA) Company Bio
Nexa Resources is a Brazilian miner of zinc and other metals being spun out of Votorantim. The company is based in São Paulo, Brazil. In addition to zinc, which accounted for 64.0% of their mined metal production in 2016 measured on a zinc equivalent basis, they produce substantial amounts of copper, lead, silver and gold as byproducts.
Latest NEXA News From Around the Web
Below are the latest news stories about NEXA RESOURCES SA that investors may wish to consider to help them evaluate NEXA as an investment opportunity.
Nexa Resources S.A. (NEXA) Stock Moves -1.33%: What You Should KnowNexa Resources S.A. (NEXA) closed the most recent trading day at $5.95, moving -1.33% from the previous trading session. |
Nexa Announces Filing of Annual Report on Form 20-F For The Fiscal Year Ended 2022 and Publication of Mining ReportNexa Resources S.A. ("Nexa Resources" or "Nexa" or the "Company") (NYSE:NEXA) announces that it has filed its annual report on Form 20-F for the fiscal year ended December 31, 2022 with the U.S. |
Nexa Announces 2022 Year-End Mineral Reserves and Mineral ResourcesNexa Resources S.A. |
Nexa Provides Update on Cerro Lindo Mine Operation/ Nexa Resources S.A. |
Nexa Announces Increase in the Aripuanã Mineral Reserves and Extension of Mine Life/ Nexa Resources S.A. |
NEXA Price Returns
1-mo | 8.84% |
3-mo | 4.12% |
6-mo | 25.96% |
1-year | -30.97% |
3-year | 99.86% |
5-year | -57.16% |
YTD | 3.61% |
2022 | -20.07% |
2021 | -16.38% |
2020 | 26.99% |
2019 | -28.32% |
2018 | -37.85% |
NEXA Dividends
Ex-Dividend Date | Type | Payout Amount | Change | ||||||
---|---|---|---|---|---|---|---|---|---|
Loading, please wait... |
Continue Researching NEXA
Want to see what other sources are saying about Nexa Resources SA's financials and stock price? Try the links below:Nexa Resources SA (NEXA) Stock Price | Nasdaq
Nexa Resources SA (NEXA) Stock Quote, History and News - Yahoo Finance
Nexa Resources SA (NEXA) Stock Price and Basic Information | MarketWatch
Loading social stream, please wait...