Northfield Bancorp, Inc. (NFBK): Price and Financial Metrics
GET POWR RATINGS... FREE!
NFBK POWR Grades
- Stability is the dimension where NFBK ranks best; there it ranks ahead of 91.72% of US stocks.
- The strongest trend for NFBK is in Sentiment, which has been heading down over the past 179 days.
- NFBK's current lowest rank is in the Value metric (where it is better than 22.17% of US stocks).
NFBK Stock Summary
- The ratio of debt to operating expenses for NORTHFIELD BANCORP INC is higher than it is for about 87.52% of US stocks.
- Equity multiplier, or assets relative to shareholders' equity, comes in at 7.77 for NORTHFIELD BANCORP INC; that's greater than it is for 86.27% of US stocks.
- As for revenue growth, note that NFBK's revenue has grown -5.38% over the past 12 months; that beats the revenue growth of merely 17.89% of US companies in our set.
- Stocks with similar financial metrics, market capitalization, and price volatility to NORTHFIELD BANCORP INC are KRNY, HONE, TBNK, RMBI, and GHLD.
- NFBK's SEC filings can be seen here. And to visit NORTHFIELD BANCORP INC's official web site, go to www.enorthfield.com.
NFBK Valuation Summary
- NFBK's price/earnings ratio is 11.9; this is 4.39% higher than that of the median Financial Services stock.
- NFBK's price/sales ratio has moved down 6.2 over the prior 185 months.
Below are key valuation metrics over time for NFBK.
Stock | Date | P/S | P/B | P/E | EV/EBIT |
---|---|---|---|---|---|
NFBK | 2023-01-23 | 4.6 | 1.1 | 11.9 | 14.0 |
NFBK | 2023-01-20 | 4.6 | 1.1 | 12.0 | 14.0 |
NFBK | 2023-01-19 | 4.6 | 1.1 | 11.8 | 13.9 |
NFBK | 2023-01-18 | 4.6 | 1.1 | 11.8 | 13.9 |
NFBK | 2023-01-17 | 4.6 | 1.1 | 11.9 | 14.0 |
NFBK | 2023-01-13 | 4.7 | 1.1 | 12.0 | 14.1 |
NFBK Growth Metrics
- The 4 year price growth rate now stands at -39.52%.
- The 2 year net cashflow from operations growth rate now stands at 19.99%.
- The year over year revenue growth rate now stands at 11.47%.

The table below shows NFBK's growth in key financial areas (numbers in millions of US dollars).
Date | Revenue | Operating Cash Flow | Net Income to Common Stock |
---|---|---|---|
2022-09-30 | 163.077 | 79.717 | 63.083 |
2022-06-30 | 162.676 | 80.155 | 62.184 |
2022-03-31 | 169.279 | 64.159 | 66.104 |
2021-12-31 | 176.286 | 64.759 | 70.654 |
2021-09-30 | 172.35 | 68.535 | 67.613 |
2021-06-30 | 166.622 | 53.417 | 60.115 |
NFBK's Quality Factors
The “Quality” component of the POWR Ratings focuses on 31 different factors of a companies fundamentals and operational strength. Here are some key insights as we drill into the specifics of these quality attributes.- NFBK has a Quality Grade of C, ranking ahead of 44.89% of graded US stocks.
- NFBK's asset turnover comes in at 0.03 -- ranking 373rd of 428 Banking stocks.
- WASH, BCBP, and LMST are the stocks whose asset turnover ratios are most correlated with NFBK.
The table below shows NFBK's key quality metrics over time.
Period | Asset Turnover | Gross Margin | ROIC |
---|---|---|---|
2021-06-30 | 0.030 | 1 | 0.014 |
2021-03-31 | 0.028 | 1 | 0.012 |
2020-12-31 | 0.024 | 1 | 0.009 |
2020-09-30 | 0.024 | 1 | 0.008 |
2020-06-30 | 0.024 | 1 | 0.009 |
2020-03-31 | 0.024 | 1 | 0.009 |
NFBK Price Target
For more insight on analysts targets of NFBK, see our NFBK price target page. And for a list of of all stocks sorted by upside potential based on analyst target price, see our Top Price Target page.
Average Price Target | $12.13 | Average Broker Recommendation | 1.88 (Hold) |
NFBK Stock Price Chart Interactive Chart >
NFBK Price/Volume Stats
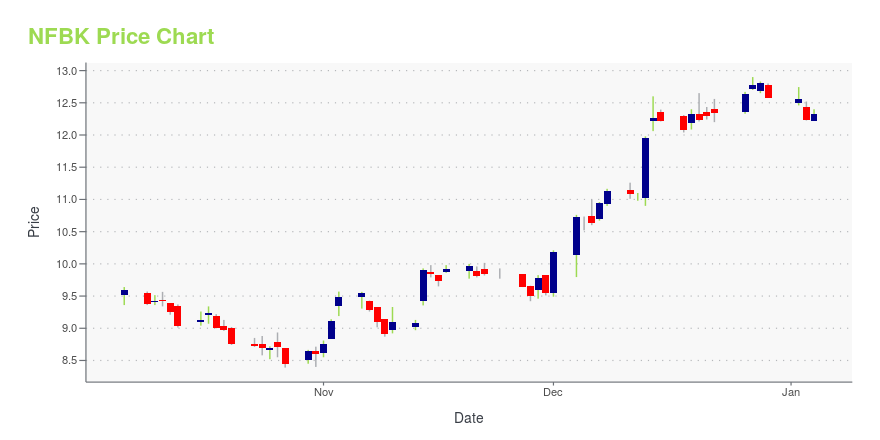
Current price | $14.37 | 52-week high | $16.69 |
Prev. close | $15.68 | 52-week low | $11.87 |
Day low | $14.17 | Volume | 222,574 |
Day high | $15.74 | Avg. volume | 117,029 |
50-day MA | $15.63 | Dividend yield | 3.32% |
200-day MA | $14.46 | Market Cap | 686.47M |
Northfield Bancorp, Inc. (NFBK) Company Bio
Northfield Bancorp, Inc. provides various banking products and services primarily to individuals and corporate customers in New York and New Jersey. The company was founded in 1887 and is based in Woodbridge, New Jersey.
Latest NFBK News From Around the Web
Below are the latest news stories about NORTHFIELD BANCORP INC that investors may wish to consider to help them evaluate NFBK as an investment opportunity.
Northfield Bancorp GAAP EPS of $0.31 misses by $0.05, revenue of $41.31M misses by $0.81M
|
Citizens Community Bancorp, Inc. (CZWI) Q4 Earnings and Revenues Surpass EstimatesCitizens Community Bancorp, Inc. (CZWI) delivered earnings and revenue surprises of 22.50% and 4.52%, respectively, for the quarter ended December 2022. Do the numbers hold clues to what lies ahead for the stock? |
Northfield Bancorp (Staten Island NY) Third Quarter 2022 Earnings: Beats ExpectationsNorthfield Bancorp (Staten Island NY) ( NASDAQ:NFBK ) Third Quarter 2022 Results Key Financial Results Revenue... |
Northfield Bancorp goes ex dividend tomorrowNorthfield Bancorp (NASDAQ:NFBK) has declared $0.13/share quarterly dividend, in line with previous.Payable Nov. 23; for shareholders of record Nov. 9; ex-div Nov. |
Why You Might Be Interested In Northfield Bancorp, Inc. (Staten Island, NY) (NASDAQ:NFBK) For Its Upcoming DividendNorthfield Bancorp, Inc. (Staten Island, NY) ( NASDAQ:NFBK ) stock is about to trade ex-dividend in four days. The... |
NFBK Price Returns
1-mo | -8.88% |
3-mo | -8.81% |
6-mo | -0.69% |
1-year | -9.04% |
3-year | -3.04% |
5-year | -1.20% |
YTD | -8.65% |
2022 | 0.87% |
2021 | 35.17% |
2020 | -24.36% |
2019 | 28.69% |
2018 | -18.56% |
NFBK Dividends
Ex-Dividend Date | Type | Payout Amount | Change | ||||||
---|---|---|---|---|---|---|---|---|---|
Loading, please wait... |
Continue Researching NFBK
Want to see what other sources are saying about Northfield Bancorp Inc's financials and stock price? Try the links below:Northfield Bancorp Inc (NFBK) Stock Price | Nasdaq
Northfield Bancorp Inc (NFBK) Stock Quote, History and News - Yahoo Finance
Northfield Bancorp Inc (NFBK) Stock Price and Basic Information | MarketWatch
Loading social stream, please wait...