
National Fuel Gas Company (NFG): Price and Financial Metrics
NFG Price/Volume Stats
| Current price | $57.92 | 52-week high | $58.60 |
| Prev. close | $57.41 | 52-week low | $45.32 |
| Day low | $57.27 | Volume | 573,300 |
| Day high | $58.14 | Avg. volume | 548,810 |
| 50-day MA | $55.86 | Dividend yield | 3.59% |
| 200-day MA | $52.40 | Market Cap | 5.32B |
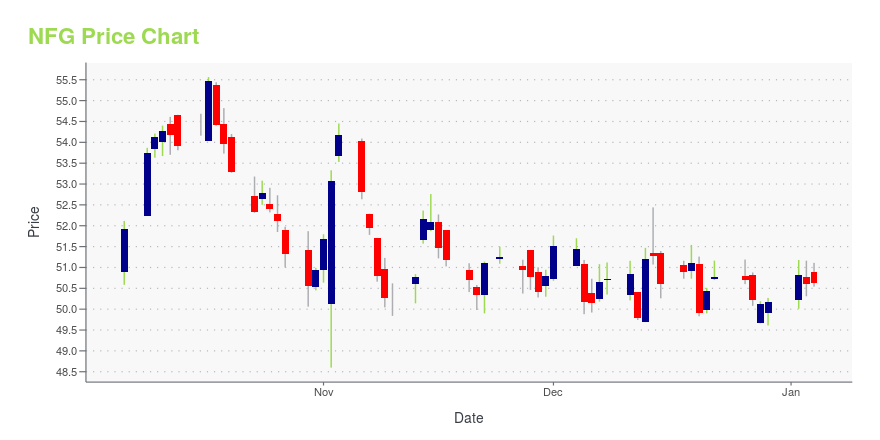
NFG Stock Price Chart Interactive Chart >
National Fuel Gas Company (NFG) Company Bio
National Fuel Gas Company explores for, develops, and produces natural gas and oil reserves in California in the Appalachian region of the United States, and in Kansas. The company also sells natural gas or provides natural gas transportation services. The company was founded in 1902 and is based in Williamsville, New York.
Latest NFG News From Around the Web
Below are the latest news stories about NATIONAL FUEL GAS CO that investors may wish to consider to help them evaluate NFG as an investment opportunity.
14 Cheap DRIP Stocks To Buy NowIn this article, we discuss 14 cheap DRIP stocks to buy now. You can skip our detailed analysis of dividend reinvestment plans and performance of dividend stocks in the past, and go directly to read 5 Cheap DRIP Stocks To Buy Now. Investing in dividend stocks is often seen as a game for patient investors […] |
AES' Board Rewards Shareholders With 4% Dividend HikeAES continues to reward shareholders through dividend hikes. It has been paying dividends for 11 consecutive years. |
National Fuel Gas (NFG) Down 4.3% Since Last Earnings Report: Can It Rebound?National Fuel Gas (NFG) reported earnings 30 days ago. What's next for the stock? We take a look at earnings estimates for some clues. |
Top 25 Natural Gas Producers in the USIn this article, we’ll discuss the top natural gas-producing companies in the US and their current dynamics. If you want to skip our detailed overview of the country’s natural gas sector, read Top 5 Natural Gas Producers in the US. The United States is rich in natural gas resources found in multiple key basins and regions. Firstly, the […] |
National Fuel Gas Company (NYSE:NFG) is favoured by institutional owners who hold 75% of the companyKey Insights Significantly high institutional ownership implies National Fuel Gas' stock price is sensitive to their... |
NFG Price Returns
| 1-mo | 6.42% |
| 3-mo | 8.62% |
| 6-mo | 23.96% |
| 1-year | 16.70% |
| 3-year | 22.18% |
| 5-year | 50.71% |
| YTD | 17.66% |
| 2023 | -17.71% |
| 2022 | 1.87% |
| 2021 | 60.66% |
| 2020 | -7.58% |
| 2019 | -5.94% |
NFG Dividends
| Ex-Dividend Date | Type | Payout Amount | Change | ||||||
|---|---|---|---|---|---|---|---|---|---|
| Loading, please wait... | |||||||||
Continue Researching NFG
Here are a few links from around the web to help you further your research on National Fuel Gas Co's stock as an investment opportunity:National Fuel Gas Co (NFG) Stock Price | Nasdaq
National Fuel Gas Co (NFG) Stock Quote, History and News - Yahoo Finance
National Fuel Gas Co (NFG) Stock Price and Basic Information | MarketWatch
Loading social stream, please wait...