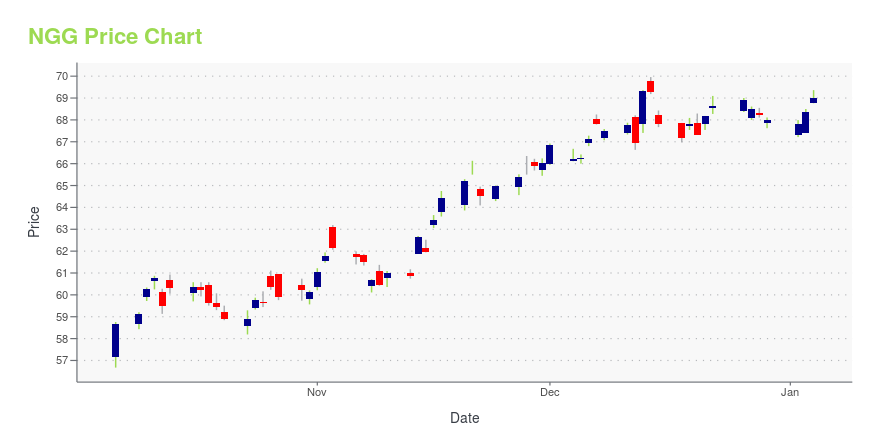
National Grid PLC ADR (NGG): Price and Financial Metrics
NGG Price/Volume Stats
| Current price | $73.52 | 52-week high | $74.82 |
| Prev. close | $74.33 | 52-week low | $55.82 |
| Day low | $73.25 | Volume | 1,176,200 |
| Day high | $74.14 | Avg. volume | 904,154 |
| 50-day MA | $71.95 | Dividend yield | 5.56% |
| 200-day MA | $65.59 | Market Cap | 71.94B |
NGG Stock Price Chart Interactive Chart >
National Grid PLC ADR (NGG) Company Bio
National Grid plc is a British multinational electricity and gas utility company headquartered in London, England. Its principal activities are in the United Kingdom, where it owns and operates electricity and natural gas transmission networks, and in the Northeastern United States, where as well as operating transmission networks, the company produces and supplies electricity and gas, providing both to customers in New York, Massachusetts, and Rhode Island. (Source:Wikipedia)
NGG Price Returns
| 1-mo | 4.23% |
| 3-mo | 15.36% |
| 6-mo | 27.75% |
| 1-year | 35.34% |
| 3-year | 30.22% |
| 5-year | 63.39% |
| YTD | 27.30% |
| 2024 | -7.27% |
| 2023 | 18.76% |
| 2022 | -12.72% |
| 2021 | 28.96% |
| 2020 | -0.80% |
NGG Dividends
| Ex-Dividend Date | Type | Payout Amount | Change | ||||||
|---|---|---|---|---|---|---|---|---|---|
| Loading, please wait... | |||||||||


Loading social stream, please wait...