National HealthCare Corporation (NHC): Price and Financial Metrics
GET POWR RATINGS... FREE!
NHC POWR Grades
- NHC scores best on the Stability dimension, with a Stability rank ahead of 95.88% of US stocks.
- NHC's strongest trending metric is Growth; it's been moving up over the last 177 days.
- NHC's current lowest rank is in the Momentum metric (where it is better than 14.26% of US stocks).
NHC Stock Summary
- NHC's went public 36.06 years ago, making it older than 92.74% of listed US stocks we're tracking.
- Price to trailing twelve month operating cash flow for NHC is currently 77.52, higher than 94.47% of US stocks with positive operating cash flow.
- With a year-over-year growth in debt of -23.35%, NATIONAL HEALTHCARE CORP's debt growth rate surpasses merely 13.2% of about US stocks.
- If you're looking for stocks that are quantitatively similar to NATIONAL HEALTHCARE CORP, a group of peers worth examining would be MRTN, USM, NATR, KNX, and SKYW.
- NHC's SEC filings can be seen here. And to visit NATIONAL HEALTHCARE CORP's official web site, go to www.nhccare.com.
NHC Valuation Summary
- NHC's EV/EBIT ratio is 22.1; this is 117.73% higher than that of the median Healthcare stock.
- NHC's price/sales ratio has moved up 0.4 over the prior 243 months.
Below are key valuation metrics over time for NHC.
Stock | Date | P/S | P/B | P/E | EV/EBIT |
---|---|---|---|---|---|
NHC | 2023-01-30 | 0.8 | 1 | 27.8 | 22.1 |
NHC | 2023-01-27 | 0.8 | 1 | 27.6 | 21.9 |
NHC | 2023-01-26 | 0.8 | 1 | 28.2 | 22.4 |
NHC | 2023-01-25 | 0.8 | 1 | 28.0 | 22.2 |
NHC | 2023-01-24 | 0.8 | 1 | 28.0 | 22.3 |
NHC | 2023-01-23 | 0.8 | 1 | 28.3 | 22.4 |
NHC Growth Metrics
- Its year over year net cashflow from operations growth rate is now at -89.26%.
- Its 2 year price growth rate is now at 7.04%.
- The 3 year price growth rate now stands at -11.2%.

The table below shows NHC's growth in key financial areas (numbers in millions of US dollars).
Date | Revenue | Operating Cash Flow | Net Income to Common Stock |
---|---|---|---|
2022-09-30 | 1,104.619 | 12.331 | 31.88 |
2022-06-30 | 1,110.513 | 21.057 | 30.961 |
2022-03-31 | 1,102.312 | 22.348 | 132.641 |
2021-12-31 | 1,074.302 | 62.394 | 138.59 |
2021-09-30 | 1,050.693 | 66.23 | 150.352 |
2021-06-30 | 1,024.582 | 88.654 | 166.549 |
NHC's Quality Factors
The “Quality” component of the POWR Ratings focuses on 31 different factors of a companies fundamentals and operational strength. Here are some key insights as we drill into the specifics of these quality attributes.- NHC has a Quality Grade of C, ranking ahead of 72.89% of graded US stocks.
- NHC's asset turnover comes in at 0.743 -- ranking 41st of 81 Healthcare stocks.
- DVCR, VCYT, and RDNT are the stocks whose asset turnover ratios are most correlated with NHC.
The table below shows NHC's key quality metrics over time.
Period | Asset Turnover | Gross Margin | ROIC |
---|---|---|---|
2021-06-30 | 0.743 | 1 | 0.174 |
2021-03-31 | 0.759 | 1 | 0.109 |
2020-12-31 | 0.777 | 1 | 0.048 |
2020-09-30 | 0.784 | 1 | 0.031 |
2020-06-30 | 0.786 | 1 | 0.037 |
2020-03-31 | 0.778 | 1 | 0.020 |
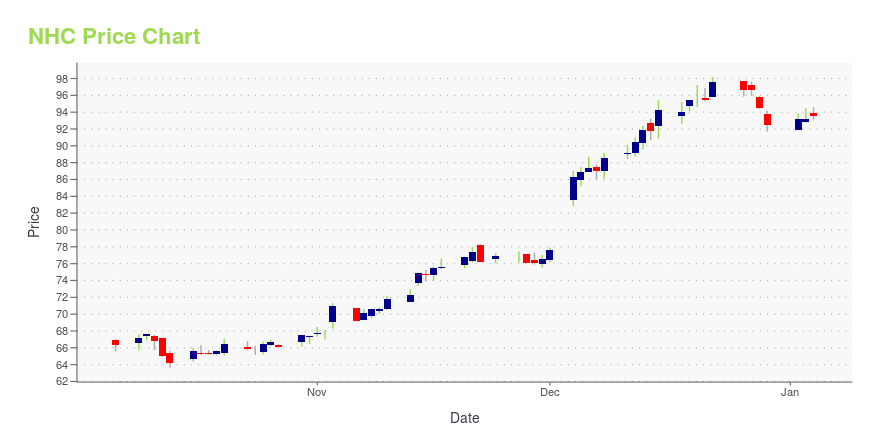
NHC Stock Price Chart Interactive Chart >
NHC Price/Volume Stats
Current price | $61.91 | 52-week high | $75.35 |
Prev. close | $62.30 | 52-week low | $55.31 |
Day low | $61.49 | Volume | 31,000 |
Day high | $62.41 | Avg. volume | 41,413 |
50-day MA | $59.36 | Dividend yield | 3.66% |
200-day MA | $65.44 | Market Cap | 949.95M |
National HealthCare Corporation (NHC) Company Bio
National Healthcare Corp. operates, manages, or provides services to skilled nursing facilities and associated assisted living centers, retirement centers, and home health care programs. The company was founded in 1971 and is based in Murfreesboro, Tennessee.
Latest NHC News From Around the Web
Below are the latest news stories about NATIONAL HEALTHCARE CORP that investors may wish to consider to help them evaluate NHC as an investment opportunity.
15 Biggest Nursing Home Companies in the USIn this article, we will discuss the 15 biggest nursing home companies in the US. If you wish to skip over the industry analysis, go directly to the 5 Biggest Nursing Home Companies in the US. The nursing home market size in the US currently stands at $148.4 billion. The industry employs over 1.5 million people. […] |
Pfizer’s Paxlovid will not be included in China’s national insuranceChinese health care authorities declined to include Pfizer's COVID-19 treatment drug in a national reimbursement list that would have allowed patients to get it at a cheaper price throughout the country, saying it was too expensive. |
UPDATE 1-SK Bioscience chief says unlikely China will source vaccines from it - FTSK Bioscience Co Ltd chief executive Jaeyong Ahn said in a Financial Times interview that it is unlikely that the vaccine maker can supply COVID-19 vaccines to China amid its recent outbreak due to Beijing's "national pride". Ahn said that it was "unrealistic" to supply COVID vaccines to China, as the country insists on using its own, the newspaper quoted him as saying. SK Bioscience is monitoring whether any COVID variants are emerging from China, the report said. |
NHC Announces Common DividendMURFREESBORO, Tenn., November 04, 2022--National HealthCare Corporation (NYSE American: NHC), the nation’s oldest publicly traded long-term health care company, announced today that it will pay a quarterly dividend of 57 cents per common share to shareholders of record on December 30, 2022 and payable on February 1, 2023. |
NHC Reports Third Quarter 2022 EarningsMURFREESBORO, Tenn., November 03, 2022--National HealthCare Corporation (NYSE American: NHC), the nation's oldest publicly traded senior health care company, announced today net operating revenues and government stimulus income for the quarter ended September 30, 2022 totaled $270,843,000 compared to $276,737,000 for the quarter ended September 30, 2021, a decrease of 2.1%. The net operating revenues decrease during the third quarter of 2022 was primarily driven by the reduction in government st |
NHC Price Returns
1-mo | 6.85% |
3-mo | 6.00% |
6-mo | -7.79% |
1-year | 0.04% |
3-year | -19.20% |
5-year | 17.69% |
YTD | 4.05% |
2022 | -9.42% |
2021 | 5.39% |
2020 | -20.66% |
2019 | 13.02% |
2018 | 32.43% |
NHC Dividends
Ex-Dividend Date | Type | Payout Amount | Change | ||||||
---|---|---|---|---|---|---|---|---|---|
Loading, please wait... |
Continue Researching NHC
Want to do more research on National Healthcare Corp's stock and its price? Try the links below:National Healthcare Corp (NHC) Stock Price | Nasdaq
National Healthcare Corp (NHC) Stock Quote, History and News - Yahoo Finance
National Healthcare Corp (NHC) Stock Price and Basic Information | MarketWatch
Loading social stream, please wait...