National Health Investors, Inc. (NHI): Price and Financial Metrics
NHI Stock Summary
- Of note is the ratio of National Health Investors Inc's sales and general administrative expense to its total operating expenses; just 6.15% of US stocks have a lower such ratio.
- For NHI, its debt to operating expenses ratio is greater than that reported by 94.42% of US equities we're observing.
- The volatility of National Health Investors Inc's share price is greater than that of merely 7.11% US stocks with at least 200 days of trading history.
- If you're looking for stocks that are quantitatively similar to National Health Investors Inc, a group of peers worth examining would be AHH, AQN, TRTN, TGH, and BRX.
- Visit NHI's SEC page to see the company's official filings. To visit the company's web site, go to www.nhireit.com.
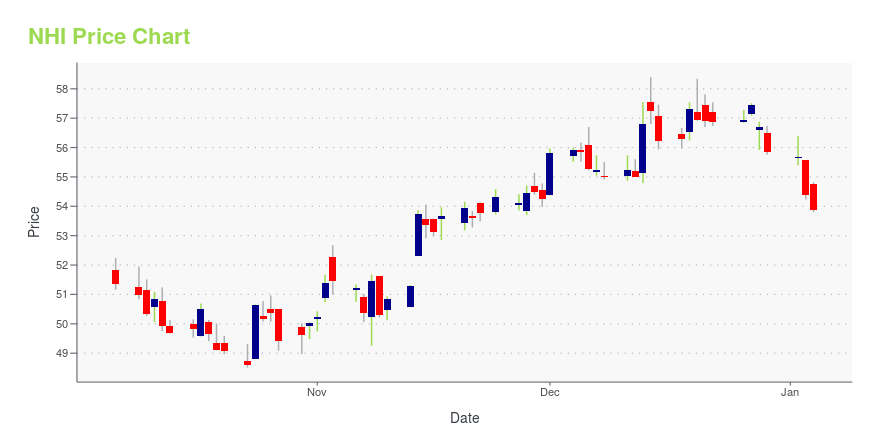
NHI Stock Price Chart Interactive Chart >
NHI Price/Volume Stats
Current price | $70.30 | 52-week high | $87.54 |
Prev. close | $70.04 | 52-week low | $31.37 |
Day low | $69.23 | Volume | 283,840 |
Day high | $71.67 | Avg. volume | 280,171 |
50-day MA | $68.10 | Dividend yield | 6.3% |
200-day MA | $63.26 | Market Cap | 3.18B |
National Health Investors, Inc. (NHI) Company Bio
National Health Investors s a real estate investment trust specializing in sale-leaseback, joint-venture, mortgage and mezzanine financing of need-driven and discretionary senior housing and medical investments. The company was founded in 1991 and is based in Murfreesboro, Tennessee.
NHI Price Forecast Based on DCF Valuation
Current Price | DCF Fair Value Target: | Forecasted Gain: |
$70.30 | $49.61 | -29% |
Below please find a table outlining a discounted cash flow forecast for NHI, in which we model out valuation assuming a variety of terminal growth rates. To summarize, we found that National Health Investors Inc ranked in the 45th percentile in terms of potential gain offered. We should note, though, that all scenearios modelled for this stock suggest it is overvalued. As for the metrics that stood out in our discounted cash flow analysis of National Health Investors Inc, consider:
- National Health Investors Inc's weighted average cost of capital (WACC) is 8%; for context, that number is higher than only 7.06% of tickers in our DCF set.
- National Health Investors Inc's effective tax rate, as measured by taxes paid relative to net income, is at 0 -- greater than merely 0% of US stocks with positive free cash flow.
- The company's cost of debt, derived from its interest coverage, tax rate, and market capitalization, is greater than only 14.42% of stocks in its sector (Real Estate).
Terminal Growth Rate in Free Cash Flow | Return Relative to Current Share Price |
0% | -31% |
1% | -30% |
2% | -29% |
3% | -28% |
4% | -28% |
5% | -27% |
Want more companies with a valuation profile/forecast similar to that of National Health Investors Inc? See AKR, AAT, LSI, RMAX, and GLPI.
Latest NHI News From Around the Web
Below are the latest news stories about National Health Investors Inc that investors may wish to consider to help them evaluate NHI as an investment opportunity.
3 High-Yield Stocks at Rock-Bottom PricesThere's no hiding that high-yield stocks can also bring high risk. These three stocks, however, offer high yields at a discount with relatively low risk. |
National Health Investors, Inc. 2020 Q4 - Results - Earnings Call PresentationThe following slide deck was published by National Health Investors, Inc. in conjunction with their 2020 Q4 earnings call.... |
National Health Investors, Inc. (NHI) CEO Eric Mendelsohn on Q4 2020 Results - Earnings Call TranscriptNational Health Investors, Inc. (NHI) Q4 2020 Earnings Conference Call February 23, 2021, 12:00 PM ET Company Participants Dana Hambly - Director, IR Eric Mendelsohn - President & CEO John Spaid - EVP & CFO Kevin Pascoe - CIO David Travis - CAO Conference Call Participants Daniel Bernstein - Capital... |
National Health Investors Inc (NHI) Q4 2020 Earnings Call TranscriptNHI earnings call for the period ending December 31, 2020. |
P/E Ratio Insights for National Health InvestorsRight now, National Health Investors Inc. (NYSE:NHI) share price is at $69.02, after a 1.01% decrease. Over the past month, the stock spiked by 4.08%, but over the past year, it actually fell by 22.09%. With questionable short-term performance like this, and great long-term performance, long-term shareholders might want to start looking into the company's price-to-earnings ratio. The stock is currently higher from its 52 week low by 120.01%. Assuming that all other factors are held constant, this could present itself as an opportunity for investors trying to diversify their portfolio with Equity Real Estate Investment Trusts (REITs) stocks, and capitalize on the lower share price observed over the year. The P/E ratio measures the current share price to the company's earnings per share. ... |
NHI Price Returns
1-mo | 4.75% |
3-mo | 7.39% |
6-mo | 13.68% |
1-year | -13.55% |
3-year | 26.24% |
5-year | 44.82% |
YTD | 1.63% |
2020 | -8.68% |
2019 | 13.67% |
2018 | 5.93% |
2017 | 6.88% |
2016 | 28.08% |
NHI Dividends
Ex-Dividend Date | Type | Payout Amount | Change | ||||||
---|---|---|---|---|---|---|---|---|---|
Loading, please wait... |
Continue Researching NHI
Want to see what other sources are saying about National Health Investors Inc's financials and stock price? Try the links below:National Health Investors Inc (NHI) Stock Price | Nasdaq
National Health Investors Inc (NHI) Stock Quote, History and News - Yahoo Finance
National Health Investors Inc (NHI) Stock Price and Basic Information | MarketWatch
Get Free Updates
Join thousands of investors who get the latest news, insights and top rated picks from StockNews.com!
Loading social stream, please wait...