
Nike Inc. CI B (NKE): Price and Financial Metrics
NKE Price/Volume Stats
| Current price | $72.56 | 52-week high | $123.39 |
| Prev. close | $71.41 | 52-week low | $70.91 |
| Day low | $71.87 | Volume | 8,890,515 |
| Day high | $72.78 | Avg. volume | 11,467,435 |
| 50-day MA | $85.78 | Dividend yield | 2.02% |
| 200-day MA | $98.24 | Market Cap | 109.52B |
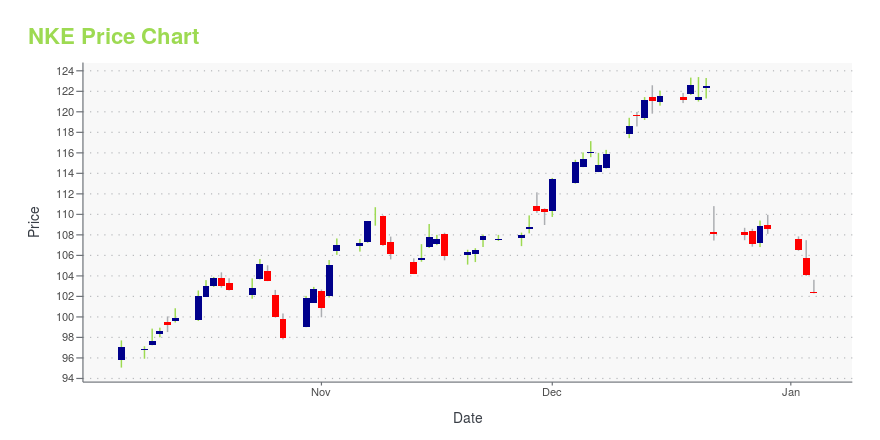
NKE Stock Price Chart Interactive Chart >
Nike Inc. CI B (NKE) Company Bio
Nike, Inc. is an American multinational corporation that is engaged in the design, development, manufacturing, and worldwide marketing and sales of footwear, apparel, equipment, accessories, and services. The company is headquartered near Beaverton, Oregon, in the Portland metropolitan area. It is the world's largest supplier of athletic shoes and apparel and a major manufacturer of sports equipment, with revenue in excess of US$37.4 billion in its fiscal year 2020 (ending May 31, 2020). As of 2020, it employed 76,700 people worldwide. In 2020 the brand alone was valued in excess of $32 billion, making it the most valuable brand among sports businesses. Previously, in 2017, the Nike brand was valued at $29.6 billion. Nike ranked No. 89 in the 2018 Fortune 500 list of the largest United States corporations by total revenue. (Source:Wikipedia)
Latest NKE News From Around the Web
Below are the latest news stories about NIKE INC that investors may wish to consider to help them evaluate NKE as an investment opportunity.
Home Fitness Phenomena: 3 Stocks Capitalizing on the Workout-from-Home TrendThese home fitness stocks are in demand as the home-based exercise trend continues to gain steam but not all are worth buying. |
AI and Automation Leaders for 2024: 7 Stocks to Stay Ahead of the Robot UprisingIt’s time for investors to ditch the search for the mythical crystal ball and instead embrace the algorithms when deciphering the best AI stock for your needs. |
Top 3 Large-Cap Growth Stock Picks for the New YearCrisis is creating opportunity for investors with some of these large-cap growth stocks for New Year 2024. |
S&P 500 Gains and Losses Today: Match Group Jumps Amid Optimistic Growth OutlookThe S&P 500 gained less than 0.1% on Thursday, Dec. 28, 2023, eking out a small advance after oscillating just beneath its all-time high. |
Midday Movers: AMD Higher on Graphics Card Report, Boeing Falls on Inspection IssueU.S. equities traded marginally higher at midday as the S&P 500 remained in striking distance of its all-time high, with the index en route to its ninth-straight week of gains. The Santa Claus Rally appeared to be materializing, as the Nasdaq edged higher to near its best year since 2003, and the Dow Jones Industrial Average remained above the all-time high closing it set Wednesday. Match Group (MTCH) shares gained as KeyBanc analysts maintained an “overweight” rating on the stock. |
NKE Price Returns
| 1-mo | -22.86% |
| 3-mo | -22.61% |
| 6-mo | -28.85% |
| 1-year | -31.65% |
| 3-year | -54.36% |
| 5-year | -12.59% |
| YTD | -32.67% |
| 2023 | -6.01% |
| 2022 | -29.04% |
| 2021 | 18.70% |
| 2020 | 40.97% |
| 2019 | 38.09% |
NKE Dividends
| Ex-Dividend Date | Type | Payout Amount | Change | ||||||
|---|---|---|---|---|---|---|---|---|---|
| Loading, please wait... | |||||||||
Continue Researching NKE
Want to see what other sources are saying about NIKE Inc's financials and stock price? Try the links below:NIKE Inc (NKE) Stock Price | Nasdaq
NIKE Inc (NKE) Stock Quote, History and News - Yahoo Finance
NIKE Inc (NKE) Stock Price and Basic Information | MarketWatch
Loading social stream, please wait...