Northrop Grumman Corp. (NOC): Price and Financial Metrics

Northrop Grumman Corp. (NOC): $478.66

1.30 (+0.27%)

POWR Rating

Component Grades

Momentum

B

Stability

B

Sentiment

Quality

C

Add NOC to Watchlist
Sign Up

Industry: Air/Defense Services

Industry

C

Ranked

#35 of 71

in industry

NOC Price/Volume Stats
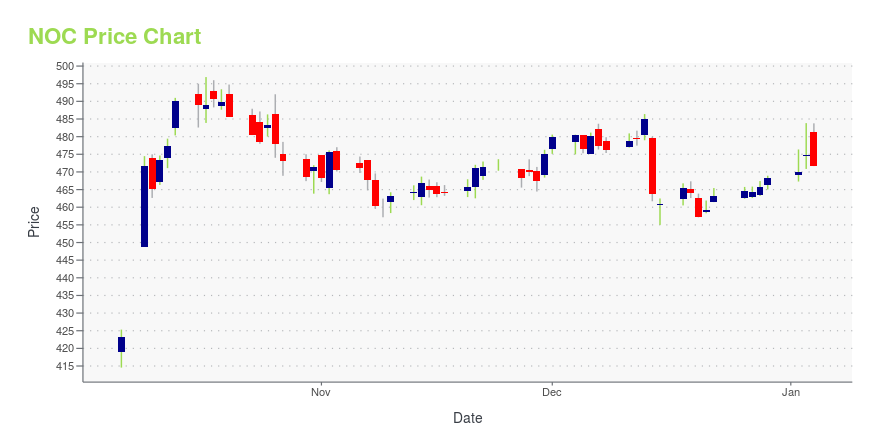
Current price $478.66 52-week high $496.89
Prev. close $477.36 52-week low $414.56
Day low $478.00 Volume 632,400
Day high $480.75 Avg. volume 947,218
50-day MA $457.68 Dividend yield 1.59%
200-day MA $455.86 Market Cap 71.82B

NOC Stock Price Chart Interactive Chart >

NOC POWR Grades

  • NOC scores best on the Stability dimension, with a Stability rank ahead of 82.57% of US stocks.
  • NOC's strongest trending metric is Stability; it's been moving down over the last 26 weeks.
  • NOC ranks lowest in Growth; there it ranks in the 18th percentile.

NOC Stock Summary

  • NOC has a market capitalization of $71,608,392,262 -- more than approximately 96.52% of US stocks.
  • NORTHROP GRUMMAN CORP's stock had its IPO on January 1, 1986, making it an older stock than 92.92% of US equities in our set.
  • In terms of volatility of its share price, NOC is more volatile than merely 2.01% of stocks we're observing.
  • Stocks that are quantitatively similar to NOC, based on their financial statements, market capitalization, and price volatility, are INFY, ITW, SHW, TT, and MNST.
  • Visit NOC's SEC page to see the company's official filings. To visit the company's web site, go to www.northropgrumman.com.

NOC Valuation Summary

  • NOC's price/sales ratio is 1.8; this is 14.29% lower than that of the median Industrials stock.
  • NOC's EV/EBIT ratio has moved down 0.1 over the prior 243 months.

Below are key valuation metrics over time for NOC.

Stock Date P/S P/B P/E EV/EBIT
NOC 2023-12-29 1.8 4.4 15.1 13.8
NOC 2023-12-28 1.8 4.4 15.0 13.7
NOC 2023-12-27 1.8 4.4 15.0 13.7
NOC 2023-12-26 1.8 4.4 15.0 13.7
NOC 2023-12-22 1.8 4.4 15.0 13.7
NOC 2023-12-21 1.8 4.3 14.8 13.6

NOC Growth Metrics

    Its 3 year cash and equivalents growth rate is now at 187.95%.
  • The 2 year net cashflow from operations growth rate now stands at -25.42%.
  • The year over year net income to common stockholders growth rate now stands at 27.66%.
NOC's revenue has moved down $638,000,000 over the prior 15 months.

The table below shows NOC's growth in key financial areas (numbers in millions of US dollars).

Date Revenue Operating Cash Flow Net Income to Common Stock
2022-12-31 36,602 2,901 4,896
2022-09-30 35,208 2,092 5,526
2022-06-30 34,957 1,920 5,674
2022-03-31 35,307 3,145 5,765
2021-12-31 35,667 3,567 7,005
2021-09-30 37,240 3,727 4,625

NOC's Quality Factors

The “Quality” component of the POWR Ratings focuses on 31 different factors of a companies fundamentals and operational strength. Here are some key insights as we drill into the specifics of these quality attributes.
  • NOC has a Quality Grade of B, ranking ahead of 81.11% of graded US stocks.
  • NOC's asset turnover comes in at 0.874 -- ranking 59th of 208 Electronic Equipment stocks.
  • MINM, QRVO, and NEON are the stocks whose asset turnover ratios are most correlated with NOC.

The table below shows NOC's key quality metrics over time.

Period Asset Turnover Gross Margin ROIC
2021-09-30 0.874 0.210 0.250
2021-06-30 0.870 0.205 0.246
2021-03-31 0.858 0.201 0.243
2020-12-31 0.837 0.203 0.166
2020-09-30 0.819 0.212 0.136
2020-06-30 0.825 0.213 0.129

NOC Price Target

For more insight on analysts targets of NOC, see our NOC price target page. And for a list of of all stocks sorted by upside potential based on analyst target price, see our Top Price Target page.

Average Price Target $412.05 Average Broker Recommendation 1.58 (Moderate Buy)

Northrop Grumman Corp. (NOC) Company Bio


Northrop Grumman Corporation (NYSENOC) is an American multinational aerospace and defense technology company. With 90,000 employees and an annual revenue in excess of $30 billion, it is one of the world's largest weapons manufacturers and military technology providers.[5][6][7][3] The firm ranks No. 96 on the 2020 Fortune 500 list of America's largest corporations. (Source:Wikipedia)


NOC Latest News Stream


Event/Time News Detail
Loading, please wait...

NOC Latest Social Stream


Loading social stream, please wait...

View Full NOC Social Stream

Latest NOC News From Around the Web

Below are the latest news stories about NORTHROP GRUMMAN CORP that investors may wish to consider to help them evaluate NOC as an investment opportunity.

Consider Defense ETFs Amid Positive Industry Outlook

With the current geopolitical landscape and increasing demand for defense equipment, investing in defense ETFs can be beneficial.

Yahoo | December 28, 2023

10 Best Space Stocks to Buy According to Wall Street Analysts

In this article, we discuss the 10 best space stocks to buy according to Wall Street analysts. If you want to skip our detailed analysis of these stocks, go directly to 5 Best Space Stocks to Buy According to Wall Street Analysts. The space sector has been one of the fastest growing sectors in the […]

Yahoo | December 24, 2023

The British start-up plotting to make computer chips in space

Making computer chips from materials forged in space may sound like an idea from a science fiction novel, but a British company is hoping to make it a reality.

Yahoo | December 23, 2023

20 Largest Air Forces in the World Heading into 2024

In this article, we look at the 20 largest air forces in the world. You can skip our detailed analysis on the aircraft fleet size of various air forces and trends in the aerospace industry by heading over directly to the 5 Largest Air Forces in the World Heading into 2024. Air Forces around the […]

Yahoo | December 23, 2023

AAR (AIR) Q2 Earnings On Par With Estimates, Sales Rise Y/Y

AAR's (AIR) fiscal second-quarter earnings and revenues increase year over year. Net interest expense also increases during the same period.

Yahoo | December 22, 2023

Read More 'NOC' Stories Here

NOC Price Returns

1-mo 4.43%
3-mo 2.67%
6-mo 9.62%
1-year 5.45%
3-year 55.37%
5-year 92.50%
YTD 2.67%
2023 -12.79%
2022 43.02%
2021 29.29%
2020 -9.92%
2019 42.69%

NOC Dividends

Ex-Dividend Date Type Payout Amount Change
Loading, please wait...
View Full NOC Dividend History

Continue Researching NOC

Want to see what other sources are saying about Northrop Grumman Corp's financials and stock price? Try the links below:

Northrop Grumman Corp (NOC) Stock Price | Nasdaq
Northrop Grumman Corp (NOC) Stock Quote, History and News - Yahoo Finance
Northrop Grumman Corp (NOC) Stock Price and Basic Information | MarketWatch

Get Free Updates

Join thousands of investors who get the latest news, insights and top rated picks from StockNews.com!