National Presto Industries, Inc. (NPK): Price and Financial Metrics

National Presto Industries, Inc. (NPK): $72.82

0.94 (+1.31%)

POWR Rating

Component Grades

Momentum

B

Stability

C

Sentiment

Quality

C

Add NPK to Watchlist
Sign Up

Industry: Home Improvement & Goods

Industry

B

Ranked

#21 of 59

in industry

NPK Price/Volume Stats
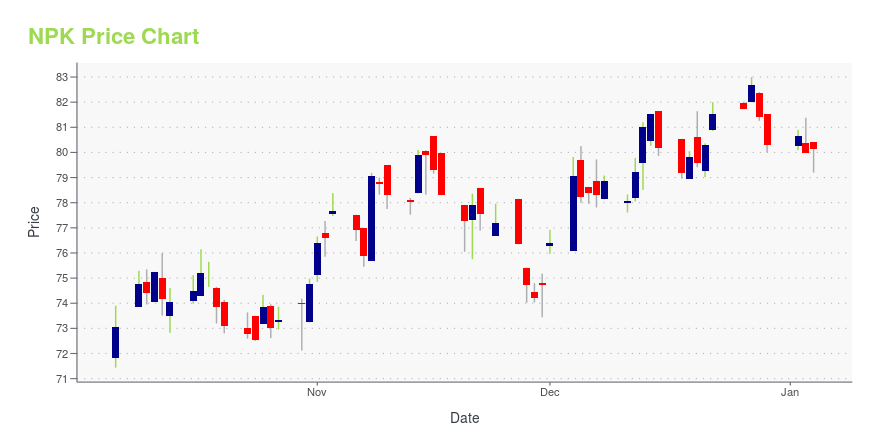
Current price $72.82 52-week high $82.59
Prev. close $71.88 52-week low $63.85
Day low $72.28 Volume 18,024
Day high $73.23 Avg. volume 27,409
50-day MA $75.48 Dividend yield 1.38%
200-day MA $73.60 Market Cap 515.49M

NPK Stock Price Chart Interactive Chart >

NPK POWR Grades

  • NPK scores best on the Momentum dimension, with a Momentum rank ahead of 79.99% of US stocks.
  • The strongest trend for NPK is in Stability, which has been heading up over the past 177 days.
  • NPK ranks lowest in Growth; there it ranks in the 18th percentile.

NPK Stock Summary

  • NPK's went public 35.76 years ago, making it older than 90.27% of listed US stocks we're tracking.
  • NPK's equity multiplier -- a measure of assets relative to shareholders'equity -- is greater than that of only 12.84% of US stocks.
  • The volatility of NATIONAL PRESTO INDUSTRIES INC's share price is greater than that of merely 4.04% US stocks with at least 200 days of trading history.
  • Stocks that are quantitatively similar to NPK, based on their financial statements, market capitalization, and price volatility, are MTC, ARKR, GHC, HTH, and FL.
  • NPK's SEC filings can be seen here. And to visit NATIONAL PRESTO INDUSTRIES INC's official web site, go to www.gopresto.com.

NPK Valuation Summary

  • In comparison to the median Industrials stock, NPK's price/sales ratio is 21.05% lower, now standing at 1.5.
  • Over the past 243 months, NPK's price/earnings ratio has gone up 15.3.

Below are key valuation metrics over time for NPK.

Stock Date P/S P/B P/E EV/EBIT
NPK 2023-09-19 1.5 1.5 20.3 14.2
NPK 2023-09-18 1.5 1.6 20.9 14.7
NPK 2023-09-15 1.6 1.6 20.9 14.7
NPK 2023-09-14 1.6 1.6 21.2 15.0
NPK 2023-09-13 1.6 1.6 21.0 14.8
NPK 2023-09-12 1.5 1.6 20.5 14.4

NPK Growth Metrics

    Its 3 year cash and equivalents growth rate is now at 33.69%.
  • Its 5 year cash and equivalents growth rate is now at 158.94%.
  • Its year over year price growth rate is now at -35.06%.
NPK's revenue has moved down $528,000 over the prior 33 months.

The table below shows NPK's growth in key financial areas (numbers in millions of US dollars).

Date Revenue Operating Cash Flow Net Income to Common Stock
2022-09-30 307.982 16.839 21.766
2022-06-30 325.524 26.477 16.968
2022-03-31 335.504 33.327 19.576
2021-12-31 355.777 34.688 25.654
2021-09-30 361.292 47.278 36.355
2021-06-30 368.004 32.443 44.364

NPK's Quality Factors

The “Quality” component of the POWR Ratings focuses on 31 different factors of a companies fundamentals and operational strength. Here are some key insights as we drill into the specifics of these quality attributes.
  • NPK has a Quality Grade of B, ranking ahead of 80.23% of graded US stocks.
  • NPK's asset turnover comes in at 0.895 -- ranking 5th of 12 Defense stocks.
  • RGR, POWW, and AJRD are the stocks whose asset turnover ratios are most correlated with NPK.

The table below shows NPK's key quality metrics over time.

Period Asset Turnover Gross Margin ROIC
2021-07-04 0.895 0.226 0.202
2021-04-04 0.895 0.237 0.213
2020-12-31 0.863 0.241 0.206
2020-09-27 0.848 0.233 0.198
2020-06-28 0.812 0.254 0.220
2020-03-29 0.784 0.243 0.205

National Presto Industries, Inc. (NPK) Company Bio


National Presto Industries provides housewares and small appliances, and defense and absorbent products primarily in North America. It operates in three segments: Housewares/Small Appliance, Defense Products, and Absorbent Products. The company was founded in 1905 and is based in Eau Claire, Wisconsin.


NPK Latest News Stream


Event/Time News Detail
Loading, please wait...

NPK Latest Social Stream


Loading social stream, please wait...

View Full NPK Social Stream

Latest NPK News From Around the Web

Below are the latest news stories about NATIONAL PRESTO INDUSTRIES INC that investors may wish to consider to help them evaluate NPK as an investment opportunity.

Is The Market Rewarding National Presto Industries, Inc. (NYSE:NPK) With A Negative Sentiment As A Result Of Its Mixed Fundamentals?

National Presto Industries (NYSE:NPK) has had a rough three months with its share price down 11%. It is possible that...

Yahoo | September 11, 2023

The Returns On Capital At National Presto Industries (NYSE:NPK) Don't Inspire Confidence

If we're looking to avoid a business that is in decline, what are the trends that can warn us ahead of time? More often...

Yahoo | August 21, 2023

National Presto Industries (NYSE:NPK) investors are sitting on a loss of 9.6% if they invested five years ago

The main aim of stock picking is to find the market-beating stocks. But the main game is to find enough winners to more...

Yahoo | May 13, 2023

With 54% ownership, National Presto Industries, Inc. (NYSE:NPK) boasts of strong institutional backing

Key Insights Given the large stake in the stock by institutions, National Presto Industries' stock price might be...

Yahoo | April 17, 2023

Are National Presto Industries, Inc.'s (NYSE:NPK) Mixed Financials Driving The Negative Sentiment?

National Presto Industries (NYSE:NPK) has had a rough month with its share price down 7.2%. It seems that the market...

Yahoo | March 29, 2023

Read More 'NPK' Stories Here

NPK Price Returns

1-mo -0.45%
3-mo -0.22%
6-mo 1.01%
1-year 19.34%
3-year 2.20%
5-year -24.93%
YTD 12.30%
2022 -11.79%
2021 -1.82%
2020 7.53%
2019 -20.41%
2018 17.57%

NPK Dividends

Ex-Dividend Date Type Payout Amount Change
Loading, please wait...
View Full NPK Dividend History

Get Free Updates

Join thousands of investors who get the latest news, insights and top rated picks from StockNews.com!