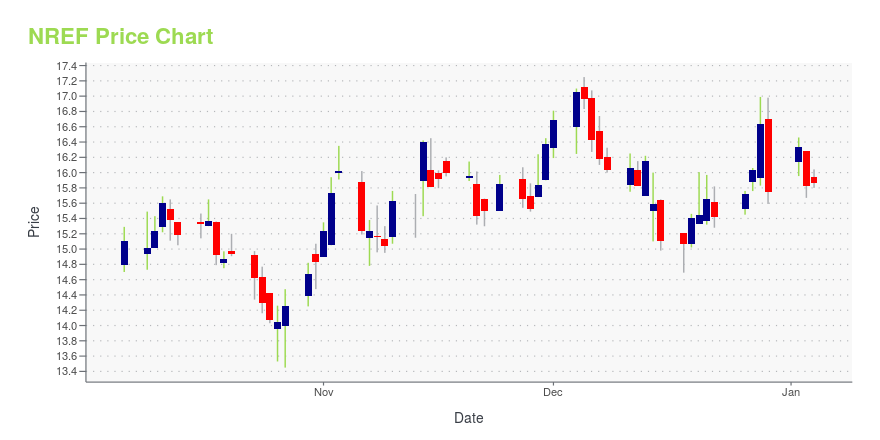
NexPoint Real Estate Finance Inc. (NREF): Price and Financial Metrics
NREF Price/Volume Stats
| Current price | $15.67 | 52-week high | $18.09 |
| Prev. close | $15.44 | 52-week low | $12.63 |
| Day low | $15.47 | Volume | 30,800 |
| Day high | $15.78 | Avg. volume | 35,327 |
| 50-day MA | $16.36 | Dividend yield | 12.95% |
| 200-day MA | $14.91 | Market Cap | 273.61M |
NREF Stock Price Chart Interactive Chart >
NexPoint Real Estate Finance Inc. (NREF) Company Bio
NexPoint Real Estate Finance, Inc. engages in the provision of commercial real estate investment services. It focuses on investment in real estate sectors including multifamily, single-family rental, self-storage, hospitality, and office sectors. The company was founded on June 7, 2019 and is headquartered in Dallas, TX.
NREF Price Returns
| 1-mo | -1.45% |
| 3-mo | 9.74% |
| 6-mo | 14.97% |
| 1-year | 13.37% |
| 3-year | 18.31% |
| 5-year | N/A |
| YTD | -0.13% |
| 2024 | 13.51% |
| 2023 | 17.36% |
| 2022 | -8.90% |
| 2021 | 27.81% |
| 2020 | N/A |
NREF Dividends
| Ex-Dividend Date | Type | Payout Amount | Change | ||||||
|---|---|---|---|---|---|---|---|---|---|
| Loading, please wait... | |||||||||


Loading social stream, please wait...