Nustar Energy L.P. Common Units (NS): Price and Financial Metrics
GET POWR RATINGS... FREE!
NS POWR Grades
- NS scores best on the Momentum dimension, with a Momentum rank ahead of 92.12% of US stocks.
- NS's strongest trending metric is Growth; it's been moving up over the last 177 days.
- NS's current lowest rank is in the Sentiment metric (where it is better than 21.86% of US stocks).
NS Stock Summary
- The price/operating cash flow metric for NUSTAR ENERGY LP is higher than just 14.88% of stocks in our set with a positive cash flow.
- For NS, its debt to operating expenses ratio is greater than that reported by 97.4% of US equities we're observing.
- In terms of volatility of its share price, NS is more volatile than just 9.81% of stocks we're observing.
- Stocks with similar financial metrics, market capitalization, and price volatility to NUSTAR ENERGY LP are CSAN, LXU, PBA, MAA, and TRN.
- NS's SEC filings can be seen here. And to visit NUSTAR ENERGY LP's official web site, go to www.nustarenergy.com.
NS Valuation Summary
- NS's price/earnings ratio is 7.6; this is 8.43% lower than that of the median Energy stock.
- NS's price/earnings ratio has moved up 0.8 over the prior 243 months.
Below are key valuation metrics over time for NS.
Stock | Date | P/S | P/B | P/E | EV/EBIT |
---|---|---|---|---|---|
NS | 2023-03-20 | 1 | 1.9 | 7.6 | 11.5 |
NS | 2023-03-17 | 1 | 1.9 | 7.6 | 11.5 |
NS | 2023-03-16 | 1 | 1.9 | 7.7 | 11.5 |
NS | 2023-03-15 | 1 | 1.9 | 7.6 | 11.4 |
NS | 2023-03-14 | 1 | 2.0 | 7.9 | 11.6 |
NS | 2023-03-13 | 1 | 1.9 | 7.9 | 11.6 |
NS Growth Metrics
- Its 2 year net cashflow from operations growth rate is now at -9.88%.
- Its 3 year revenue growth rate is now at -15.5%.
- Its 4 year revenue growth rate is now at -16.07%.

The table below shows NS's growth in key financial areas (numbers in millions of US dollars).
Date | Revenue | Operating Cash Flow | Net Income to Common Stock |
---|---|---|---|
2022-12-31 | 1,683.223 | 527.549 | 222.747 |
2022-09-30 | 1,670.679 | 508.157 | 188.662 |
2022-06-30 | 1,669.781 | 509.528 | 4.096 |
2022-03-31 | 1,666.717 | 501.651 | 8.28 |
2021-12-31 | 1,618.5 | 501.478 | 38.225 |
2021-09-30 | 1,587.726 | 540.238 | -3.761 |
NS's Quality Factors
The “Quality” component of the POWR Ratings focuses on 31 different factors of a companies fundamentals and operational strength. Here are some key insights as we drill into the specifics of these quality attributes.- NS has a Quality Grade of C, ranking ahead of 58.9% of graded US stocks.
- NS's asset turnover comes in at 0.268 -- ranking 75th of 137 Transportation stocks.
- FDX, RRTS, and MPLX are the stocks whose asset turnover ratios are most correlated with NS.
The table below shows NS's key quality metrics over time.
Period | Asset Turnover | Gross Margin | ROIC |
---|---|---|---|
2021-06-30 | 0.268 | 0.351 | 0.034 |
2021-03-31 | 0.251 | 0.354 | 0.030 |
2020-12-31 | 0.253 | 0.368 | 0.004 |
2020-09-30 | 0.252 | 0.377 | 0.011 |
2020-06-30 | 0.251 | 0.372 | 0.029 |
2020-03-31 | 0.251 | 0.365 | 0.029 |
NS Price Target
For more insight on analysts targets of NS, see our NS price target page. And for a list of of all stocks sorted by upside potential based on analyst target price, see our Top Price Target page.
Average Price Target | $19.09 | Average Broker Recommendation | 1.82 (Hold) |
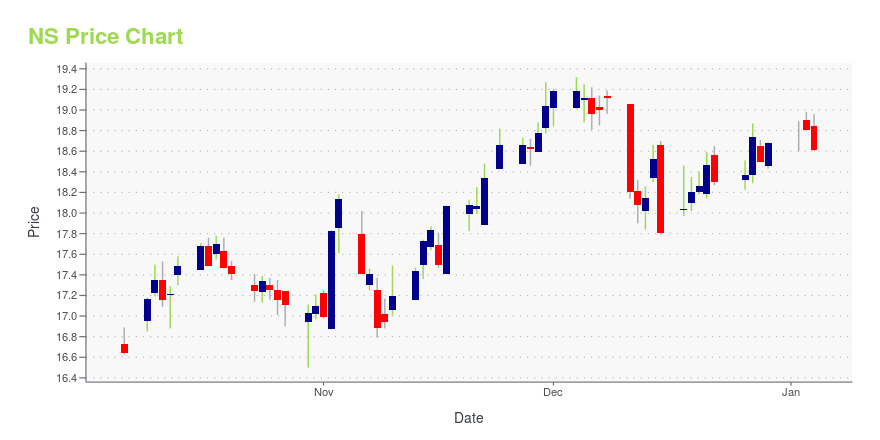
NS Stock Price Chart Interactive Chart >
NS Price/Volume Stats
Current price | $15.67 | 52-week high | $17.75 |
Prev. close | $15.62 | 52-week low | $12.80 |
Day low | $15.57 | Volume | 37,842 |
Day high | $15.79 | Avg. volume | 377,214 |
50-day MA | $16.19 | Dividend yield | 10.22% |
200-day MA | $15.51 | Market Cap | 1.74B |
Nustar Energy L.P. Common Units (NS) Company Bio
NuStar Energy LP engages in the terminalling, storage, and marketing of petroleum products; and transportation of petroleum products and anhydrous ammonia primarily in the United States and the Netherlands. It operates through three segments: Pipeline, Storage, and Fuels Marketing. The company was founded in 1999 and is based in San Antonio, Texas.
Latest NS News From Around the Web
Below are the latest news stories about NUSTAR ENERGY LP that investors may wish to consider to help them evaluate NS as an investment opportunity.
NuStar Recognized on Newsweek’s List of "America’s Most Trustworthy Companies 2023"SAN ANTONIO, March 29, 2023--NuStar Energy L.P. (NYSE: NS) announced today that it has been recognized on Newsweek’s list of "America’s Most Trustworthy Companies 2023." NuStar was one of only four San Antonio companies to make the list along with USAA, H-E-B and iHeartMedia. |
NuStar Once Again Ranked Among Best Companies for Latinos to WorkSAN ANTONIO, March 23, 2023--NuStar Energy L.P. (NYSE: NS) announced today that for the third consecutive year, the company has been recognized by Latino Leaders Magazine as one of the "Best Companies to Work for Latinos." |
NuStar to Participate in the Seventh Annual Mizuho Energy SummitSAN ANTONIO, March 10, 2023--NuStar Energy L.P. (NYSE: NS) announced today that members of management will participate in meetings with members of the investment community at the Seventh Annual Mizuho Energy Summit on Monday, March 13, 2023 and Tuesday, March 14, 2023. The materials to be discussed in the meetings will be available on the partnership’s website by 9:30 a.m. Eastern Time, Monday, March 13, 2023. |
Why Is NuStar Energy L.P. (NS) Down 6.4% Since Last Earnings Report?NuStar Energy L.P. (NS) reported earnings 30 days ago. What's next for the stock? We take a look at earnings estimates for some clues. |
NuStar Energy L.P.’s 2022 Schedule K-1 Tax Packages Now AvailableSAN ANTONIO, March 01, 2023--NuStar Energy L.P. (NYSE: NS) today announced that the 2022 tax packages, which include the Schedule K-1’s for Series A, Series B and Series C preferred units and common units, are available online at www.nustarenergy.com in the Investors section of the website. The partnership expects to begin mailing the 2022 tax packages on March 6, 2023. For additional information, NuStar Energy L.P. unitholders may call K-1 Tax Package Support toll free at (844) 364-7560 for Ser |
NS Price Returns
1-mo | -0.32% |
3-mo | 0.29% |
6-mo | 21.85% |
1-year | 20.44% |
3-year | 151.80% |
5-year | 27.63% |
YTD | 0.29% |
2022 | 11.55% |
2021 | 21.45% |
2020 | -37.07% |
2019 | 34.94% |
2018 | -22.10% |
NS Dividends
Ex-Dividend Date | Type | Payout Amount | Change | ||||||
---|---|---|---|---|---|---|---|---|---|
Loading, please wait... |
Continue Researching NS
Want to do more research on NuStar Energy LP's stock and its price? Try the links below:NuStar Energy LP (NS) Stock Price | Nasdaq
NuStar Energy LP (NS) Stock Quote, History and News - Yahoo Finance
NuStar Energy LP (NS) Stock Price and Basic Information | MarketWatch
Loading social stream, please wait...