NetApp Inc. (NTAP): Price and Financial Metrics
GET POWR RATINGS... FREE!
NTAP POWR Grades
- Quality is the dimension where NTAP ranks best; there it ranks ahead of 95.48% of US stocks.
- The strongest trend for NTAP is in Value, which has been heading up over the past 177 days.
- NTAP's current lowest rank is in the Momentum metric (where it is better than 18.72% of US stocks).
NTAP Stock Summary
- NETAPP INC's capital turnover -- a measure of revenue relative to shareholder's equity -- is better than 92.7% of US listed stocks.
- Equity multiplier, or assets relative to shareholders' equity, comes in at 10.28 for NETAPP INC; that's greater than it is for 90.83% of US stocks.
- In terms of volatility of its share price, NTAP is more volatile than just 11.4% of stocks we're observing.
- Stocks that are quantitatively similar to NTAP, based on their financial statements, market capitalization, and price volatility, are APPN, DIOD, CGNX, EBAY, and SONM.
- NTAP's SEC filings can be seen here. And to visit NETAPP INC's official web site, go to www.netapp.com.
NTAP Valuation Summary
- NTAP's EV/EBIT ratio is 13.2; this is 30.89% lower than that of the median Technology stock.
- Over the past 243 months, NTAP's EV/EBIT ratio has gone down 37.7.
Below are key valuation metrics over time for NTAP.
Stock | Date | P/S | P/B | P/E | EV/EBIT |
---|---|---|---|---|---|
NTAP | 2023-03-21 | 2.1 | 12.5 | 10.7 | 13.2 |
NTAP | 2023-03-20 | 2.1 | 12.2 | 10.5 | 12.9 |
NTAP | 2023-03-17 | 2.0 | 11.9 | 10.2 | 12.6 |
NTAP | 2023-03-16 | 2.1 | 12.0 | 10.3 | 12.7 |
NTAP | 2023-03-15 | 2.0 | 11.9 | 10.1 | 12.5 |
NTAP | 2023-03-14 | 2.0 | 11.9 | 10.2 | 12.5 |
NTAP Growth Metrics
- Its 3 year revenue growth rate is now at 2.8%.
- The 3 year net cashflow from operations growth rate now stands at -9.69%.
- The 2 year cash and equivalents growth rate now stands at 54.7%.

The table below shows NTAP's growth in key financial areas (numbers in millions of US dollars).
Date | Revenue | Operating Cash Flow | Net Income to Common Stock |
---|---|---|---|
2022-09-30 | 6,549 | 1,166 | 1,475 |
2022-06-30 | 6,452 | 1,250 | 949 |
2022-03-31 | 6,318 | 1,211 | 937 |
2021-12-31 | 6,193 | 1,359 | 1,012 |
2021-09-30 | 6,049 | 1,472 | 942 |
2021-06-30 | 5,899 | 1,335 | 855 |
NTAP's Quality Factors
The “Quality” component of the POWR Ratings focuses on 31 different factors of a companies fundamentals and operational strength. Here are some key insights as we drill into the specifics of these quality attributes.- NTAP has a Quality Grade of A, ranking ahead of 97.85% of graded US stocks.
- NTAP's asset turnover comes in at 0.662 -- ranking 43rd of 83 Computers stocks.
- QMCO, OMQS, and CSCO are the stocks whose asset turnover ratios are most correlated with NTAP.
The table below shows NTAP's key quality metrics over time.
Period | Asset Turnover | Gross Margin | ROIC |
---|---|---|---|
2021-07-30 | 0.662 | 0.668 | 0.505 |
2021-04-30 | 0.659 | 0.664 | 0.426 |
2021-01-29 | 0.677 | 0.666 | 0.376 |
2020-10-30 | 0.694 | 0.667 | 0.446 |
2020-07-31 | 0.709 | 0.671 | 0.588 |
2020-04-24 | 0.715 | 0.669 | 0.709 |
NTAP Price Target
For more insight on analysts targets of NTAP, see our NTAP price target page. And for a list of of all stocks sorted by upside potential based on analyst target price, see our Top Price Target page.
Average Price Target | $92.14 | Average Broker Recommendation | 1.67 (Moderate Buy) |
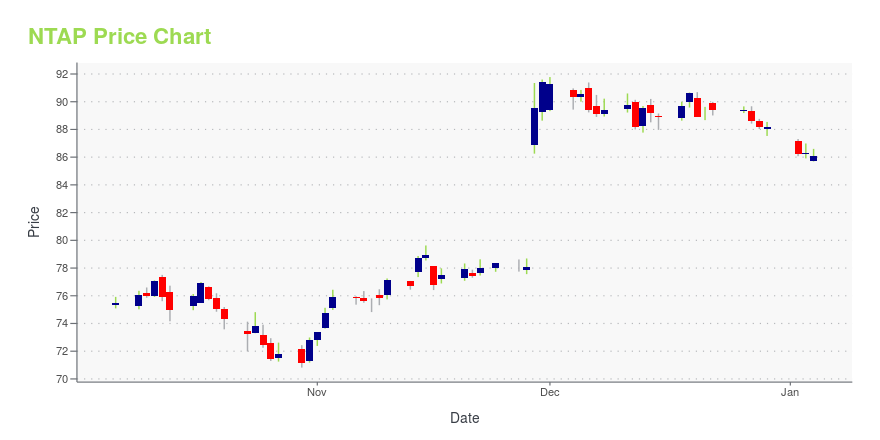
NTAP Stock Price Chart Interactive Chart >
NTAP Price/Volume Stats
Current price | $62.05 | 52-week high | $88.53 |
Prev. close | $60.78 | 52-week low | $58.08 |
Day low | $61.40 | Volume | 1,256,000 |
Day high | $62.25 | Avg. volume | 1,889,235 |
50-day MA | $64.89 | Dividend yield | 3.24% |
200-day MA | $66.75 | Market Cap | 13.27B |
NetApp Inc. (NTAP) Company Bio
NetApp, Inc. is an American hybrid cloud data services and data management company headquartered in San Jose, California. It has ranked in the Fortune 500 since 2012. Founded in 1992 with an IPO in 1995, NetApp offers cloud data services for management of applications and data both online and physically. (Source:Wikipedia)
Latest NTAP News From Around the Web
Below are the latest news stories about NETAPP INC that investors may wish to consider to help them evaluate NTAP as an investment opportunity.
NetApp’s 2023 Cloud Complexity Report Highlights the Shifting Demands of a Multicloud EnvironmentSAN JOSE, Calif., March 29, 2023--NetApp® (NASDAQ: NTAP), a global, cloud-led, data-centric software company, today released the 2023 Cloud Complexity Report, a global survey exploring how technology decision makers are navigating cloud requirements coming from digital transformation and AI initiatives and the complexity of multicloud environments. The report found that 98% of senior IT leaders have been impacted by increasing cloud complexity in some capacity, potentially leading to poor IT per |
NetApp (NTAP) Down 7.1% Since Last Earnings Report: Can It Rebound?NetApp (NTAP) reported earnings 30 days ago. What's next for the stock? We take a look at earnings estimates for some clues. |
3 Storage Devices Stocks to Look For Amid Industry WeaknessDespite macroeconomic headwinds and supply chain troubles, momentum in cloud computing, IoT, auto, connected devices, VR and AI will likely favor the prospects of the Zacks Computer - Storage Devices industry players like NTAP, PSTG and TDC. |
NetApp (NTAP) & CGI to Aid Clients Unlock Cloud PotentialNetApp (NTAP) and CGI collaborate to offer hybrid cloud-managed services that will help clients improve their operational efficiency and transform their data. |
CGI partners with NetApp to help clients accelerate data-intensive digital transformation in the cloudCGI (NYSE: GIB) (TSX: GIB.A) today announced a new global alliance partnership with NetApp® (NASDAQ: NTAP) focused on helping organizations across industry sectors unlock the full potential of hybrid and multi-cloud environments to drive flexibility, efficiencies and cost savings in the management of their applications and use of their data. Through this new alliance, CGI and NetApp will provide clients with a single, consistent cloud environment, unified data services, and centralized managemen |
NTAP Price Returns
1-mo | -3.87% |
3-mo | 4.15% |
6-mo | 1.90% |
1-year | -26.16% |
3-year | 67.51% |
5-year | 16.26% |
YTD | 4.15% |
2022 | -32.92% |
2021 | 42.47% |
2020 | 10.94% |
2019 | 7.43% |
2018 | 9.67% |
NTAP Dividends
Ex-Dividend Date | Type | Payout Amount | Change | ||||||
---|---|---|---|---|---|---|---|---|---|
Loading, please wait... |
Continue Researching NTAP
Here are a few links from around the web to help you further your research on NetApp Inc's stock as an investment opportunity:NetApp Inc (NTAP) Stock Price | Nasdaq
NetApp Inc (NTAP) Stock Quote, History and News - Yahoo Finance
NetApp Inc (NTAP) Stock Price and Basic Information | MarketWatch
Loading social stream, please wait...