
Northern Technologies International Corporation (NTIC): Price and Financial Metrics
NTIC Price/Volume Stats
| Current price | $13.62 | 52-week high | $19.63 |
| Prev. close | $13.46 | 52-week low | $10.08 |
| Day low | $13.16 | Volume | 29,022 |
| Day high | $13.66 | Avg. volume | 40,026 |
| 50-day MA | $16.39 | Dividend yield | 2.09% |
| 200-day MA | $14.00 | Market Cap | 128.41M |
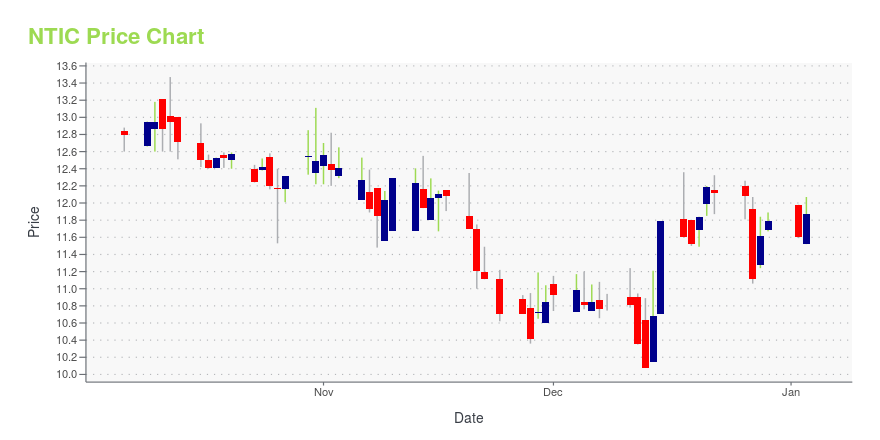
NTIC Stock Price Chart Interactive Chart >
Latest NTIC News From Around the Web
Below are the latest news stories about NORTHERN TECHNOLOGIES INTERNATIONAL CORP that investors may wish to consider to help them evaluate NTIC as an investment opportunity.
A Look At The Fair Value Of Northern Technologies International Corporation (NASDAQ:NTIC)Key Insights Using the 2 Stage Free Cash Flow to Equity, Northern Technologies International fair value estimate is... |
Northern Technologies (NTIC) Q4 Earnings and Sales Lag EstimatesHigher sales within ZERUST oil and gas and Natur-Tec product categories on the back of increased customer demand drive Northern Technologies' (NTIC) Q4 sales. |
Q4 2023 Northern Technologies International Corp Earnings CallQ4 2023 Northern Technologies International Corp Earnings Call |
Northern Technologies International Corp (NTIC) Reports Fiscal Year 2023 ResultsRecord Sales Amidst Economic Challenges, Net Income and Joint Venture Performance Detailed |
Northern Technologies International Corporation Reports Financial Results For Fourth Quarter and Full Year Fiscal 2023MINNEAPOLIS, Nov. 21, 2023 (GLOBE NEWSWIRE) -- Northern Technologies International Corporation (NASDAQ: NTIC), a leading developer of corrosion inhibiting products and services, as well as bio-based and biodegradable polymer resin compounds, today reported its financial results for the fourth quarter and fiscal year ended August 31, 2023. Full year fiscal 2023 financial and operating highlights include (with growth rates on a fiscal year-over-year basis): Consolidated net sales increased 7.7% to |
NTIC Price Returns
| 1-mo | -11.44% |
| 3-mo | -21.00% |
| 6-mo | 3.47% |
| 1-year | 12.38% |
| 3-year | -22.55% |
| 5-year | 33.29% |
| YTD | 16.59% |
| 2023 | -9.36% |
| 2022 | -10.94% |
| 2021 | 47.33% |
| 2020 | -24.55% |
| 2019 | -3.29% |
NTIC Dividends
| Ex-Dividend Date | Type | Payout Amount | Change | ||||||
|---|---|---|---|---|---|---|---|---|---|
| Loading, please wait... | |||||||||
Continue Researching NTIC
Here are a few links from around the web to help you further your research on Northern Technologies International Corp's stock as an investment opportunity:Northern Technologies International Corp (NTIC) Stock Price | Nasdaq
Northern Technologies International Corp (NTIC) Stock Quote, History and News - Yahoo Finance
Northern Technologies International Corp (NTIC) Stock Price and Basic Information | MarketWatch
Loading social stream, please wait...