
Network-1 Technologies, Inc. (NTIP): Price and Financial Metrics
NTIP Price/Volume Stats
| Current price | $1.61 | 52-week high | $2.60 |
| Prev. close | $1.58 | 52-week low | $1.52 |
| Day low | $1.58 | Volume | 26,600 |
| Day high | $1.64 | Avg. volume | 16,740 |
| 50-day MA | $1.66 | Dividend yield | 6.21% |
| 200-day MA | $2.00 | Market Cap | 37.70M |
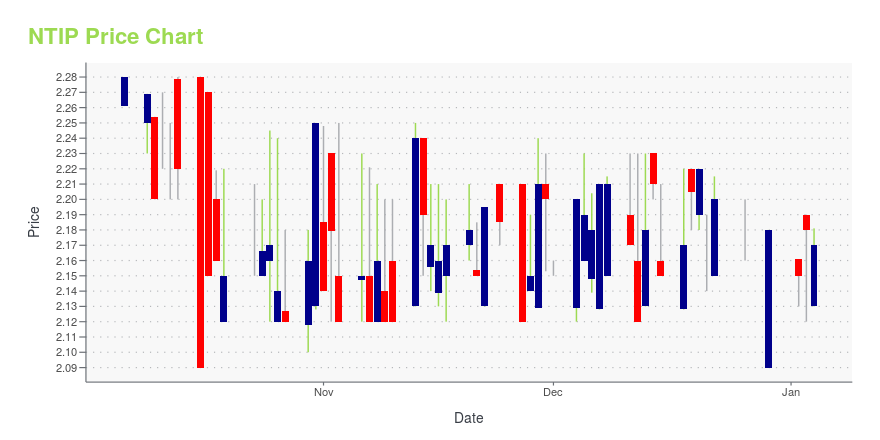
NTIP Stock Price Chart Interactive Chart >
Network-1 Technologies, Inc. (NTIP) Company Bio
Network-1 Technologies, Inc. develops, licenses, and protects intellectual property assets. The company owns 33 patents, including the remote power patent covering the delivery of power over Ethernet cables for the purpose of remotely powering network devices, such as wireless access ports, IP phones, and network based cameras; and the Mirror Worlds patent portfolio relating to foundational technologies that enable unified search and indexing, displaying, and archiving of documents in a computer system. The company was founded in 1990 and is based in New York City, New York.
Latest NTIP News From Around the Web
Below are the latest news stories about NETWORK-1 TECHNOLOGIES INC that investors may wish to consider to help them evaluate NTIP as an investment opportunity.
Network-1 Reports Third Quarter ResultsNEW CANAAN, CT / ACCESSWIRE / November 2, 2023 / Network-1 Technologies, Inc. (NYSE American:NTIP), a company specializing in the development, licensing, and monetization of its intellectual property assets, today announced financial results for the ... |
Network-1 Declares Semi-Annual DividendNetwork-1 Technologies, Inc. (NYSE American:NTIP) today announced that its Board of Directors has declared a semi-annual cash dividend of $0.05 per common share pursuant to its dividend policy. |
ILiAD Biotechnologies Reports First-ever Demonstration of Protection Against B. pertussis Colonization in Phase 2b Human Challenge Study of BPZE1 VaccineNetwork-1 Technologies, Inc. (NYSE American:NTIP), a company engaged in the acquisition, development, licensing, and monetization of intellectual property, announced today that ILiAD Biotechnologies, LLC reported the first-ever demonstration of protection against B. |
Network-1 Receives New eSIM Patent from U.S. Patent Office Expanding Its M2M/IoT Patent Portfolio to 50 Patents WorldwideNetwork-1 Technologies, Inc. (NYSE American:NTIP), a company engaged in the acquisition, development, licensing, and monetization of intellectual property, announced today that the U.S. Patent and Trademark Office has issued U.S. Patent No. |
Network-1 Reports Second Quarter ResultsNetwork-1 Technologies, Inc. (NYSE AMERICAN:NTIP), a company specializing in the development, licensing, and monetization of its intellectual property assets, today announced financial results for the quarter ended June 30, 2023. |
NTIP Price Returns
| 1-mo | 0.63% |
| 3-mo | -17.01% |
| 6-mo | -23.32% |
| 1-year | -24.78% |
| 3-year | -39.20% |
| 5-year | -20.10% |
| YTD | -24.37% |
| 2023 | 3.47% |
| 2022 | -18.70% |
| 2021 | -21.09% |
| 2020 | 77.37% |
| 2019 | 1.81% |
NTIP Dividends
| Ex-Dividend Date | Type | Payout Amount | Change | ||||||
|---|---|---|---|---|---|---|---|---|---|
| Loading, please wait... | |||||||||
Continue Researching NTIP
Here are a few links from around the web to help you further your research on Network 1 Technologies Inc's stock as an investment opportunity:Network 1 Technologies Inc (NTIP) Stock Price | Nasdaq
Network 1 Technologies Inc (NTIP) Stock Quote, History and News - Yahoo Finance
Network 1 Technologies Inc (NTIP) Stock Price and Basic Information | MarketWatch
Loading social stream, please wait...