Intellia Therapeutics, Inc. (NTLA): Price and Financial Metrics
GET POWR RATINGS... FREE!
NTLA POWR Grades
- Value is the dimension where NTLA ranks best; there it ranks ahead of 24.44% of US stocks.
- The strongest trend for NTLA is in Growth, which has been heading down over the past 177 days.
- NTLA's current lowest rank is in the Sentiment metric (where it is better than 7.51% of US stocks).
NTLA Stock Summary
- Of note is the ratio of INTELLIA THERAPEUTICS INC's sales and general administrative expense to its total operating expenses; merely 7.33% of US stocks have a lower such ratio.
- With a price/sales ratio of 59.13, INTELLIA THERAPEUTICS INC has a higher such ratio than 96.68% of stocks in our set.
- As for revenue growth, note that NTLA's revenue has grown 91.84% over the past 12 months; that beats the revenue growth of 90.87% of US companies in our set.
- Stocks with similar financial metrics, market capitalization, and price volatility to INTELLIA THERAPEUTICS INC are RLAY, ATRA, ARCT, FATE, and IGMS.
- Visit NTLA's SEC page to see the company's official filings. To visit the company's web site, go to www.intelliatx.com.
NTLA Valuation Summary
- In comparison to the median Healthcare stock, NTLA's price/earnings ratio is 126.43% lower, now standing at -6.
- Over the past 82 months, NTLA's EV/EBIT ratio has gone up 44.9.
Below are key valuation metrics over time for NTLA.
Stock | Date | P/S | P/B | P/E | EV/EBIT |
---|---|---|---|---|---|
NTLA | 2023-01-20 | 51.8 | 3.2 | -6.0 | -5.9 |
NTLA | 2023-01-19 | 51.0 | 3.2 | -5.9 | -5.8 |
NTLA | 2023-01-18 | 55.2 | 3.4 | -6.4 | -6.3 |
NTLA | 2023-01-17 | 56.7 | 3.5 | -6.6 | -6.5 |
NTLA | 2023-01-13 | 57.6 | 3.6 | -6.7 | -6.6 |
NTLA | 2023-01-12 | 58.5 | 3.6 | -6.8 | -6.7 |
NTLA Growth Metrics
- Its 4 year net income to common stockholders growth rate is now at -191.14%.
- Its 4 year cash and equivalents growth rate is now at -68.55%.
- Its 4 year revenue growth rate is now at 117.94%.

The table below shows NTLA's growth in key financial areas (numbers in millions of US dollars).
Date | Revenue | Operating Cash Flow | Net Income to Common Stock |
---|---|---|---|
2022-09-30 | 51.402 | -298.069 | -442.016 |
2022-06-30 | 45.34 | -284.565 | -400.431 |
2022-03-31 | 37.86 | -252.455 | -368.559 |
2021-12-31 | 33.053 | -225.03 | -267.892 |
2021-09-30 | 26.794 | -210.605 | -228.847 |
2021-06-30 | 41.81 | -174.141 | -185.043 |
NTLA's Quality Factors
The “Quality” component of the POWR Ratings focuses on 31 different factors of a companies fundamentals and operational strength. Here are some key insights as we drill into the specifics of these quality attributes.- NTLA has a Quality Grade of D, ranking ahead of 18.09% of graded US stocks.
- NTLA's asset turnover comes in at 0.066 -- ranking 302nd of 681 Pharmaceutical Products stocks.
- AGIO, CMRX, and JAZZ are the stocks whose asset turnover ratios are most correlated with NTLA.
The table below shows NTLA's key quality metrics over time.
Period | Asset Turnover | Gross Margin | ROIC |
---|---|---|---|
2021-06-30 | 0.066 | 1 | -0.397 |
2021-03-31 | 0.088 | 1 | -0.420 |
2020-12-31 | 0.120 | 1 | -0.510 |
2020-09-30 | 0.156 | 1 | -0.586 |
2020-06-30 | 0.137 | 1 | -0.536 |
2020-03-31 | 0.135 | 1 | -0.414 |
NTLA Price Target
For more insight on analysts targets of NTLA, see our NTLA price target page. And for a list of of all stocks sorted by upside potential based on analyst target price, see our Top Price Target page.
Average Price Target | $176.19 | Average Broker Recommendation | 1.47 (Moderate Buy) |
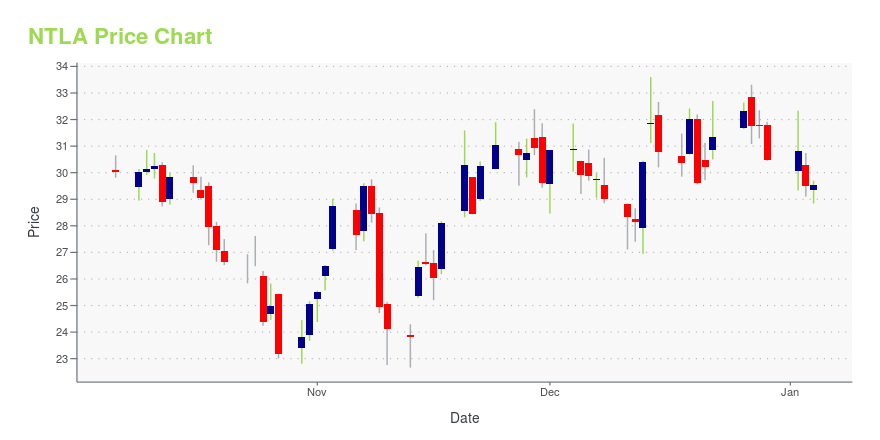
NTLA Stock Price Chart Interactive Chart >
NTLA Price/Volume Stats
Current price | $40.32 | 52-week high | $104.87 |
Prev. close | $41.63 | 52-week low | $32.44 |
Day low | $39.90 | Volume | 568,583 |
Day high | $42.00 | Avg. volume | 1,151,025 |
50-day MA | $40.02 | Dividend yield | N/A |
200-day MA | $51.42 | Market Cap | 3.17B |
Intellia Therapeutics, Inc. (NTLA) Company Bio
Intellia Therapeutics a gene editing company, develops therapeutics utilizing a biological tool known as the CRISPR/Cas9 system. The company develops in vivo programs focused on liver diseases, including transthyretin amyloidosis, alpha-1 antitrypsin deficiency, hepatitis B virus, and inborn errors of metabolism; and ex vivo applications of the technology in chimeric antigen receptor T cell and hematopoietic stem cell product candidates. The company was founded in 2014 and is headquartered in Cambridge, Massachusetts.
Latest NTLA News From Around the Web
Below are the latest news stories about INTELLIA THERAPEUTICS INC that investors may wish to consider to help them evaluate NTLA as an investment opportunity.
3 Gene Editing Stocks to Buy Now OR You’ll Be Kicking Yourself LaterEven in a risk-off market, gene editing stocks look attractive. |
3 Gene Editing Stocks With the Best Long-Term PotentialThese gene editing stocks are likely to deliver massive gains ahead in the fast-evolving biotech space |
Intellia Therapeutics upgraded at Citi after recent selloffIntellia Therapeutics (NTLA) traded higher pre-market Tuesday after Citi upgraded to Neutral from Sell, citing the recent sell off and its gene editing potential. Read the full story here. |
Cathie Wood Goes Bargain Hunting: 3 Stocks She Just BoughtCathie Wood is beating the market again so far in 2023, and that leaves growth investors wondering if she can recapture her 2020 performance in a bottle. Ark puts out daily transaction reports, so we know what Wood is buying and selling. Tesla bears think they're winning with the stock down 65% since hitting all-time highs in late 2021. |
Investing in Intellia Therapeutics Inc. (NTLA) might be an excellent idea, but the stock is currently overvalued/undervaluedIn Wednesday’s session, Intellia Therapeutics Inc. (NASDAQ:NTLA) marked $36.08 per share, down from $37.05 in the previous session. While Intellia Therapeutics Inc. has underperformed by -2.62%, investors are advised to look at stock chart patterns for technical insight. Within its last year performance, NTLA fell by -60.51%, with highs and lows ranging from $104.87 to […] |
NTLA Price Returns
1-mo | 15.56% |
3-mo | -24.22% |
6-mo | -43.77% |
1-year | -53.13% |
3-year | 238.54% |
5-year | 56.89% |
YTD | 15.56% |
2022 | -70.49% |
2021 | 117.35% |
2020 | 270.82% |
2019 | 7.47% |
2018 | -28.98% |
Continue Researching NTLA
Want to see what other sources are saying about Intellia Therapeutics Inc's financials and stock price? Try the links below:Intellia Therapeutics Inc (NTLA) Stock Price | Nasdaq
Intellia Therapeutics Inc (NTLA) Stock Quote, History and News - Yahoo Finance
Intellia Therapeutics Inc (NTLA) Stock Price and Basic Information | MarketWatch
Loading social stream, please wait...